Grafana is a robust, open-source tool designed for enterprise-level monitoring and data visualization. It supports a variety of databases including Graphite, InfluxDB, Prometheus, and Elasticsearch, among others. With Grafana, you can create personalized dashboards to monitor your applications or infrastructure performance.
In this tutorial, we will guide you through the steps to install Grafana on Ubuntu 18.04 LTS (Bionic Beaver).
Prerequisites
- A server running Ubuntu 18.04 LTS.
- A non-root user with sudo privileges.
Install Grafana
Grafana is not included in the default repositories for Ubuntu 18.04. To install it, you need to add the Grafana repository to your system.
sudo nano /etc/apt/sources.list
Add the following line at the end of the file:
deb https://packagecloud.io/grafana/stable/debian/ stretch main
Save and close the file. Next, install the GPG key by running the command below:
sudo curl https://packagecloud.io/gpg.key | sudo apt-key add -
Update your package list and install Grafana:
        sudo apt-get update -y
        sudo apt-get install grafana -y
Upon successful installation, you will see output similar to the following:
Preparing to unpack .../grafana_5.1.3_amd64.deb ...
Unpacking grafana (5.1.3) ...
Setting up grafana (5.1.3) ...
Adding system user `grafana'...
Not creating home directory `/usr/share/grafana'.
### NOT starting on installation, please execute the following statements to configure Grafana to start automatically using systemd
 sudo /bin/systemctl daemon-reload
 sudo /bin/systemctl enable grafana-server
### You can start grafana-server with
 sudo /bin/systemctl start grafana-server
Initiate and configure Grafana to launch at startup:
        sudo systemctl daemon-reload
        sudo systemctl enable grafana-server
        sudo systemctl start grafana-server
Verify Grafana’s status with the following command:
sudo systemctl status grafana-server
The output should indicate that the service is running:
? grafana-server.service - Grafana instance
   Loaded: loaded
   Active: active (running) since ...
   ...
   Jun 13 15:43:19 ubuntu1804 grafana-server[19946]: t=2018-06-13T15:43:19+0000 lvl=info msg="Created default admin user: admin"
   ...
   Jun 13 15:43:20 ubuntu1804 grafana-server[19946]: t=2018-06-13T15:43:20+0000 lvl=info msg="Initializing HTTP Server" logger=http.server
Access Grafana
Having configured and started Grafana, access the Grafana dashboard using your web browser. Enter the URL http://your-server-ip:3000. You should be prompted with the following login page:

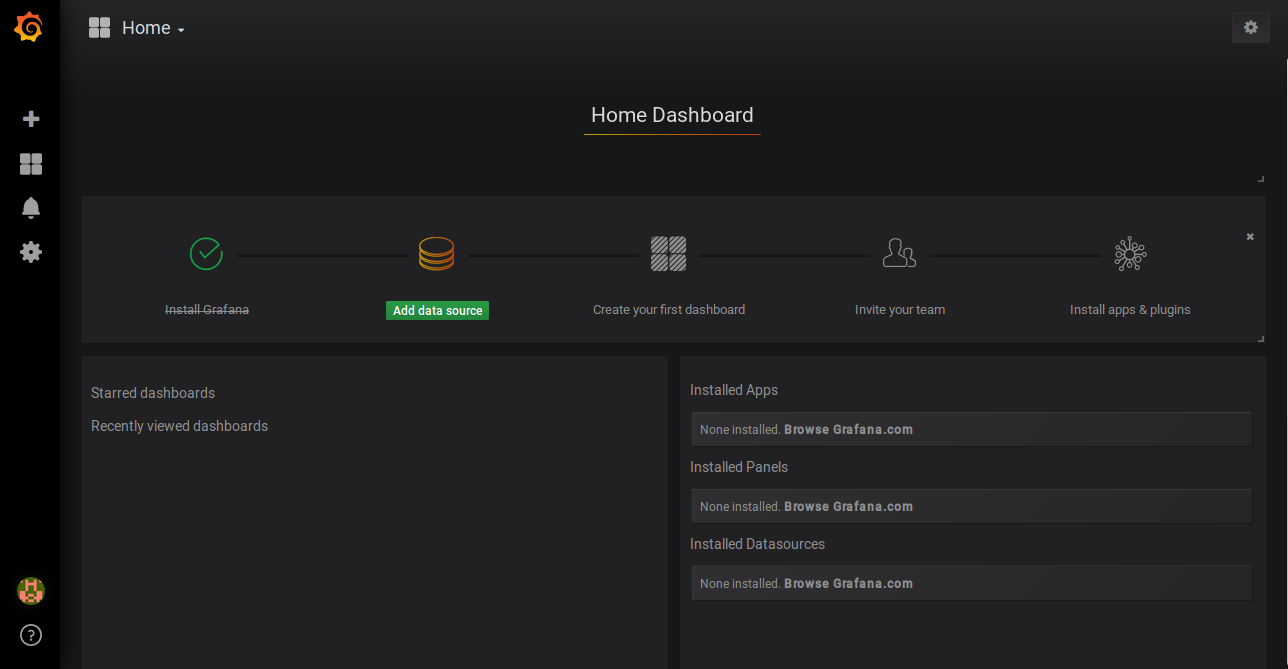
Log in with the default credentials, both username and password as “admin”. Once logged in, you will see the Grafana dashboard:

Links
FAQ
What is Grafana?
Grafana is an open-source platform used for monitoring and observability. It offers powerful querying and visualization capabilities to create custom dashboards for infrastructure and applications.
How do I change the default admin password?
Immediately after logging in for the first time, Grafana will prompt you to change the default password. Follow the on-screen instructions to set a new password.
Can I install plugins on Grafana?
Yes, Grafana supports a wide range of plugins that can be installed to extend its functionality. You can browse available plugins from the Grafana website or directly from your Grafana instance.
How do I secure my Grafana instance?
To secure your Grafana installation, ensure you change the default passwords, use SSL/TLS for web traffic, and set up firewalls to limit access. Detailed security guidelines are available in the official Grafana documentation.
