Prometheus is a robust open-source monitoring and alerting toolkit created at SoundCloud. Grafana complements it as a powerful open-source visualization and analytics tool. This guide will take you through installing and configuring Prometheus, Grafana, and Node_Exporter on two separate Ubuntu 18.04 LTS EC2 instances.
Setup Details
- Node1: Prometheus, DNS: ec2-15-188-52-60.eu-west-3.compute.amazonaws.com/
- Node2: Grafana, Node_Exporter, DNS: ec2-15-188-50-16.eu-west-3.compute.amazonaws.com/
Node_Exporter will export metrics from Node2 to Prometheus on Node1. Prometheus scrapes these metrics, and Grafana is configured to fetch them from Prometheus for visualization.
Pre-requisites
- AWS Account (Create if you don’t have one).
- Two Ubuntu 18.04 LTS VMs or EC2 Instances (Click here to learn how to create an EC2 Instance).
- Root access to the servers.
Note: EC2 instances may incur charges. Delete them from your account when no longer needed.
What We Will Do
- Install Prometheus
- Install Grafana
- Install Node-Exporter
- Integrate Grafana with Prometheus
Install Prometheus
Install the Package
Run the following commands to install Prometheus:
wget https://s3-eu-west-1.amazonaws.com/deb.robustperception.io/41EFC99D.gpg | sudo apt-key add -
sudo apt-get update -y
sudo apt-get install prometheus prometheus-node-exporter prometheus-pushgateway prometheus-alertmanager -y
Start Prometheus
Start Prometheus using:
sudo systemctl start prometheus
Enable Prometheus at Boot
Run the following command:
sudo systemctl enable prometheus
Check Prometheus Status
Use this command to verify its status:
sudo systemctl status prometheus

Access Prometheus
Access it on port 9090 using the following URL format:
http://IP-Of-Prometheus-Instance:9090/

Install Grafana
Install the Package
Run these commands to install Grafana:
sudo apt-get install -y apt-transport-https
sudo apt-get install -y software-properties-common wget
wget -q -O - https://packages.grafana.com/gpg.key | sudo apt-key add -
sudo add-apt-repository "deb https://packages.grafana.com/oss/deb stable main"
sudo apt-get update
sudo apt-get install grafana
sudo systemctl daemon-reload
Start Grafana
Use this command:
sudo systemctl start grafana-server
Enable Grafana at Boot
To enable:
sudo systemctl enable grafana-server.service
Check Grafana Status
Verify the status:
sudo systemctl status grafana-server

Access Grafana
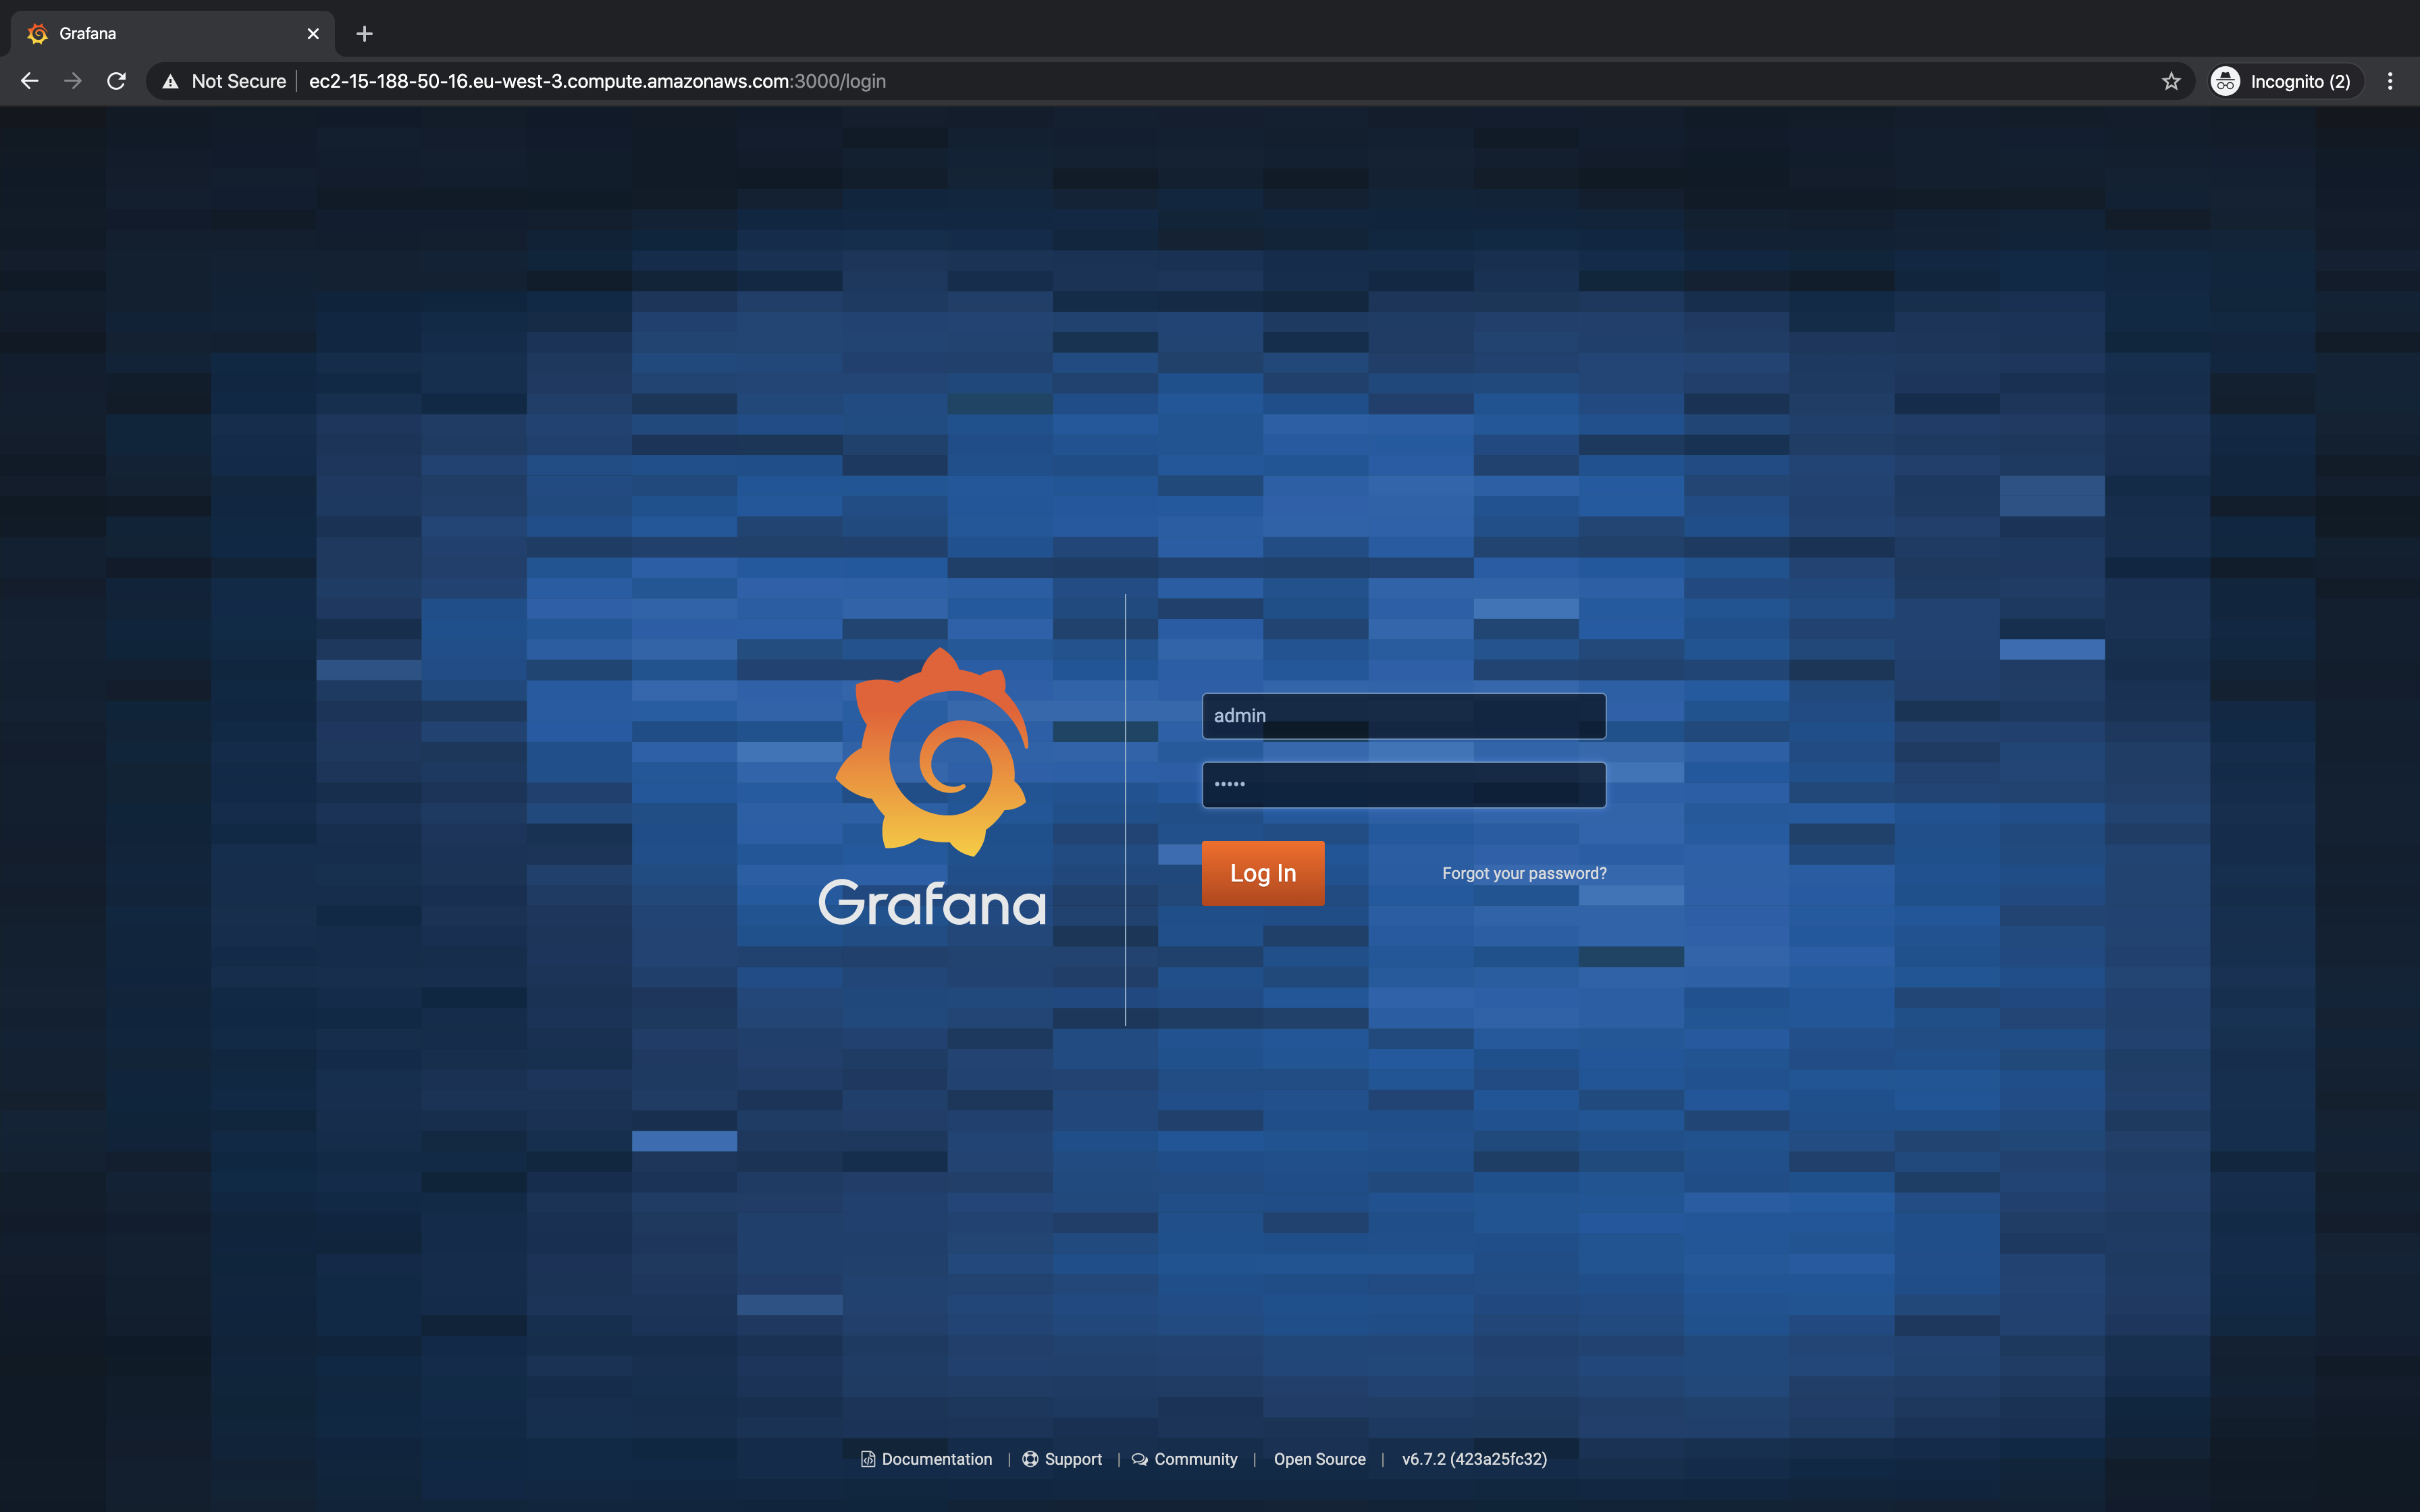
Access the UI at:
Log in with the default credentials (admin/admin) and change your password upon login.
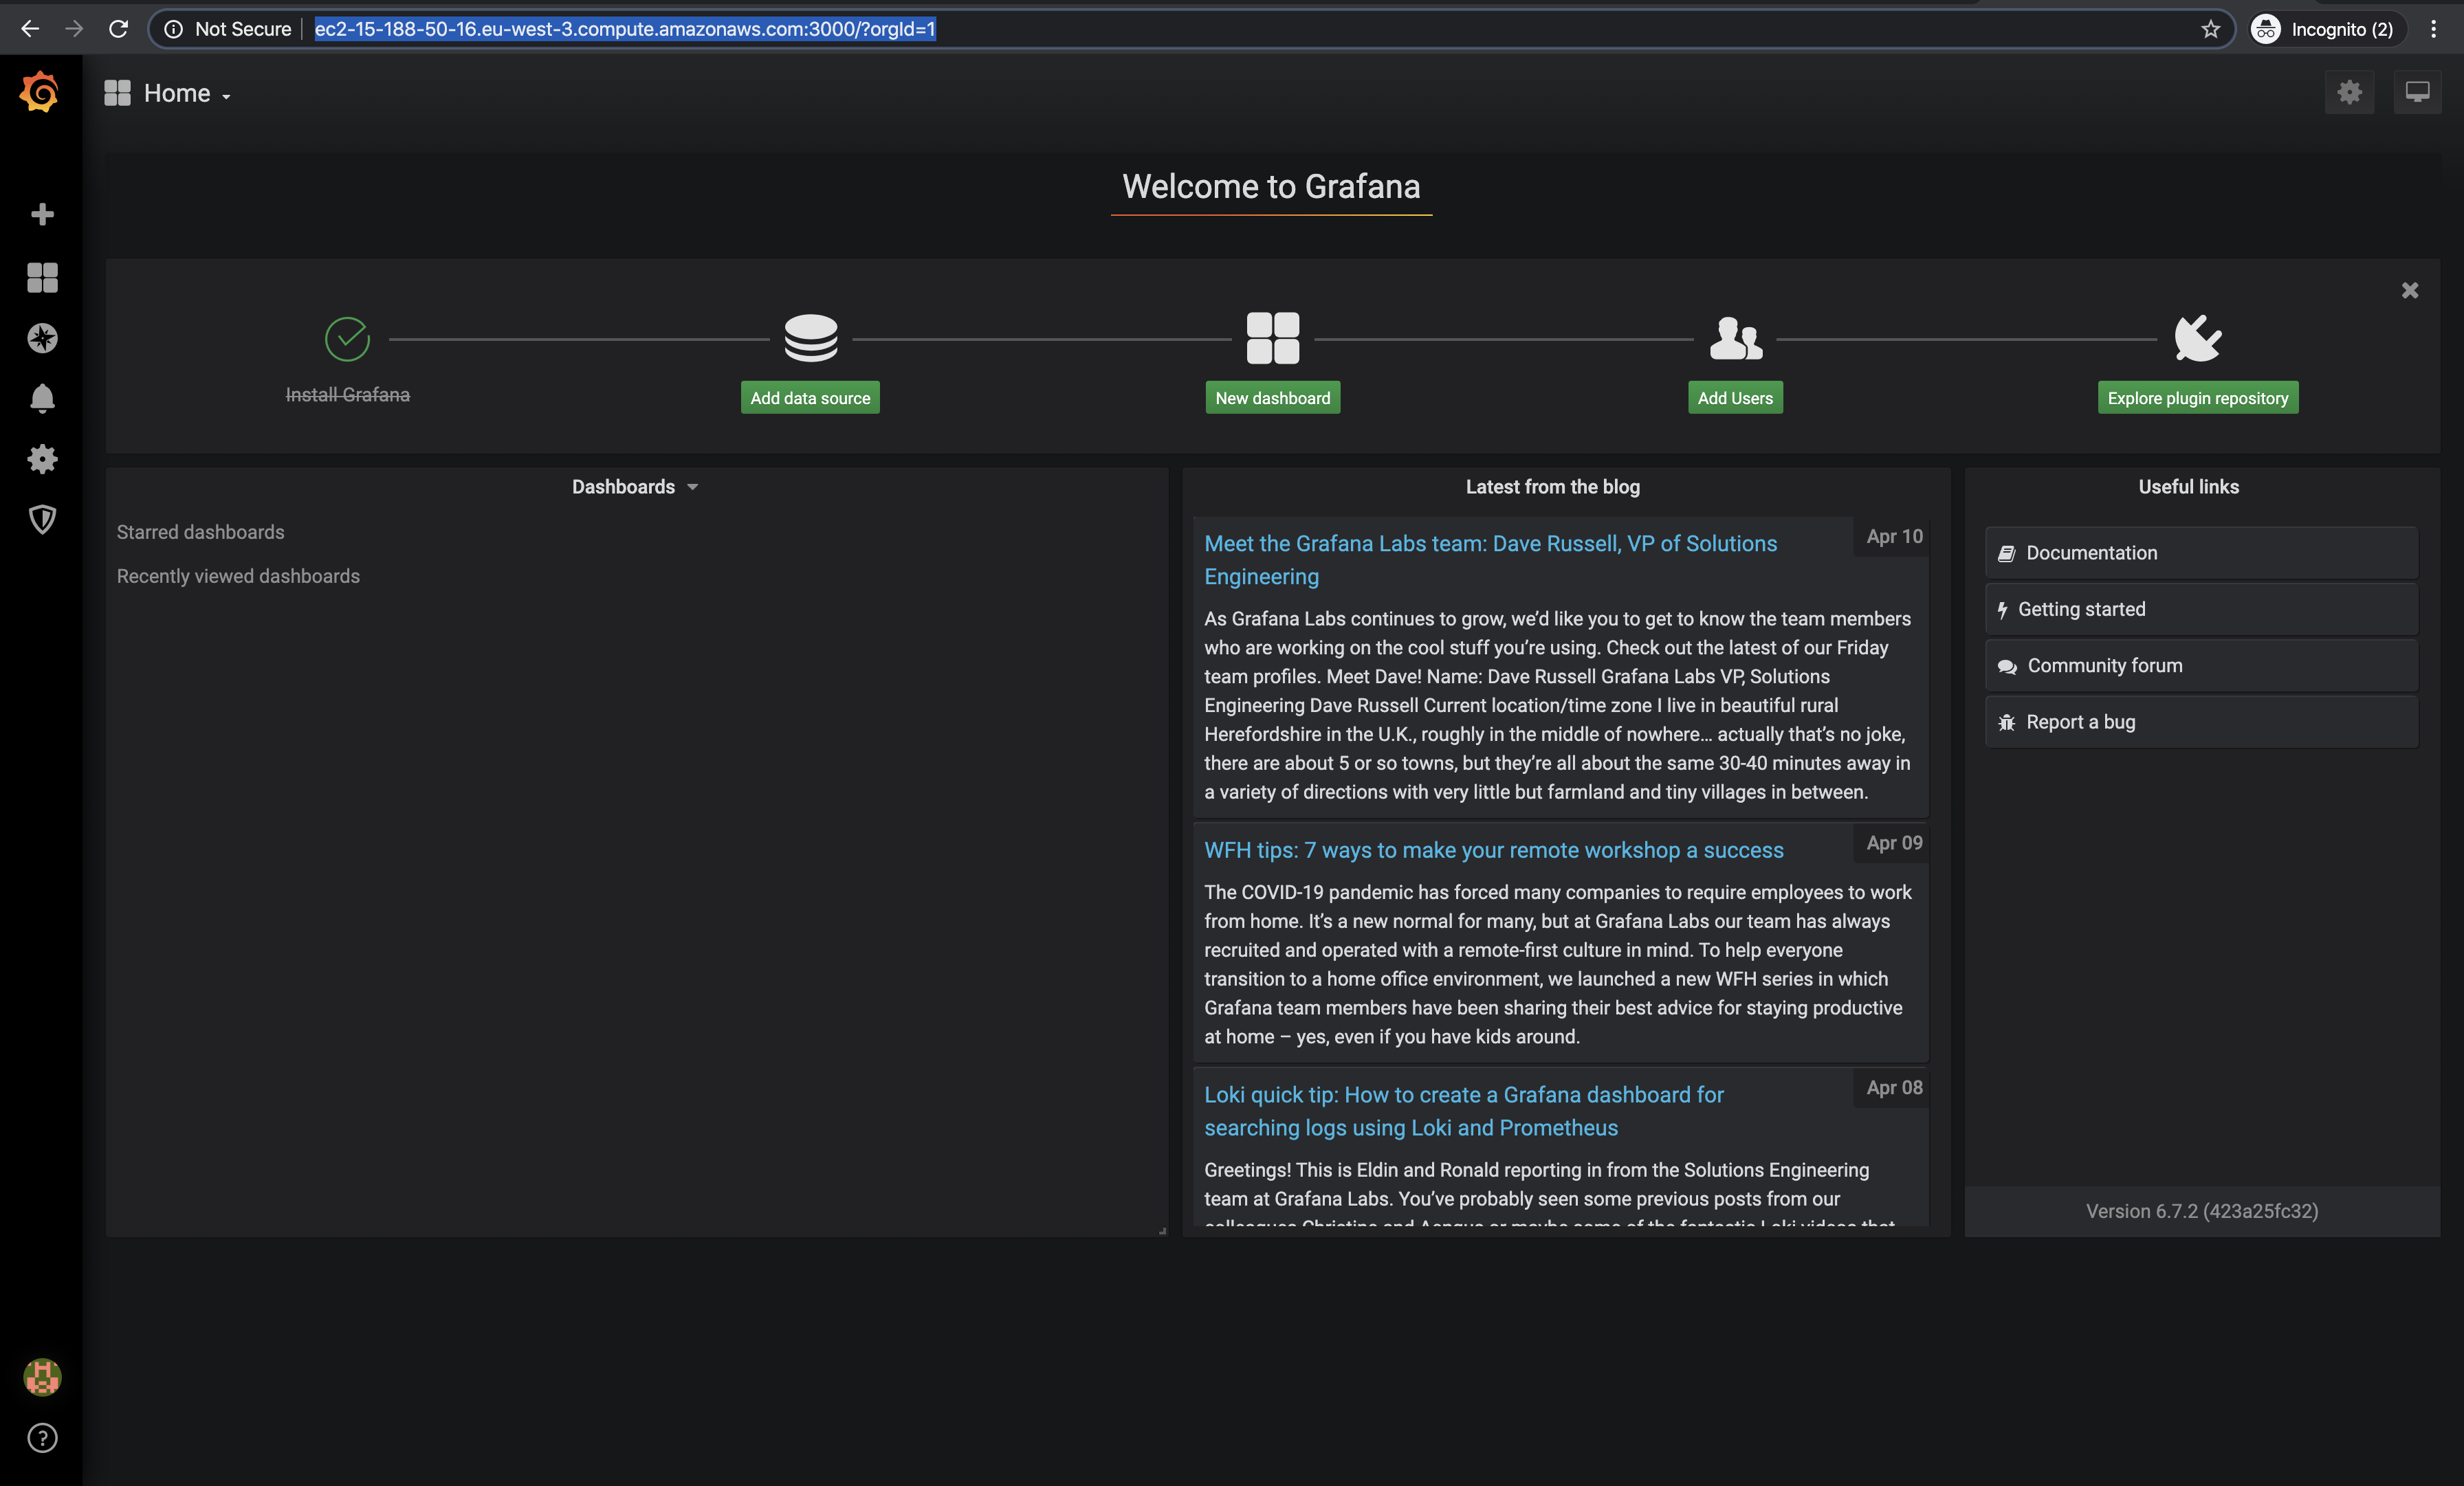
Post-login screen:
Install Node-Exporter
Install the Package
Download and install Node_Exporter:
cd /tmp/
wget https://github.com/prometheus/node_exporter/releases/download/v1.0.0-rc.0/node_exporter-1.0.0-rc.0.linux-amd64.tar.gz
tar -zxvf node_exporter-1.0.0-rc.0.linux-amd64.tar.gz
cp node_exporter-1.0.0-rc.0.linux-amd64/node_exporter /usr/local/bin/
Configure Node-Exporter
Edit the systemd service file:
vim /etc/systemd/system/node_exporter.service
[Unit]
Description=Prometheus Node Exporter
Wants=network-online.target
After=network-online.target

[Service]
User=root
Group=root
Type=simple
ExecStart=/usr/local/bin/node_exporter

[Install]
WantedBy=multi-user.target
Reload Configurations
systemctl daemon-reload
Start Node-Exporter
systemctl start node_exporter.service
Enable Node-Exporter at Boot
systemctl enable node_exporter.service
Check Node-Exporter Status
systemctl status node_exporter.service

Access Node-Exporter
Access it on port 9100:
http://IP-of-Node-Exporter:9100/

Integrate Grafana with Prometheus
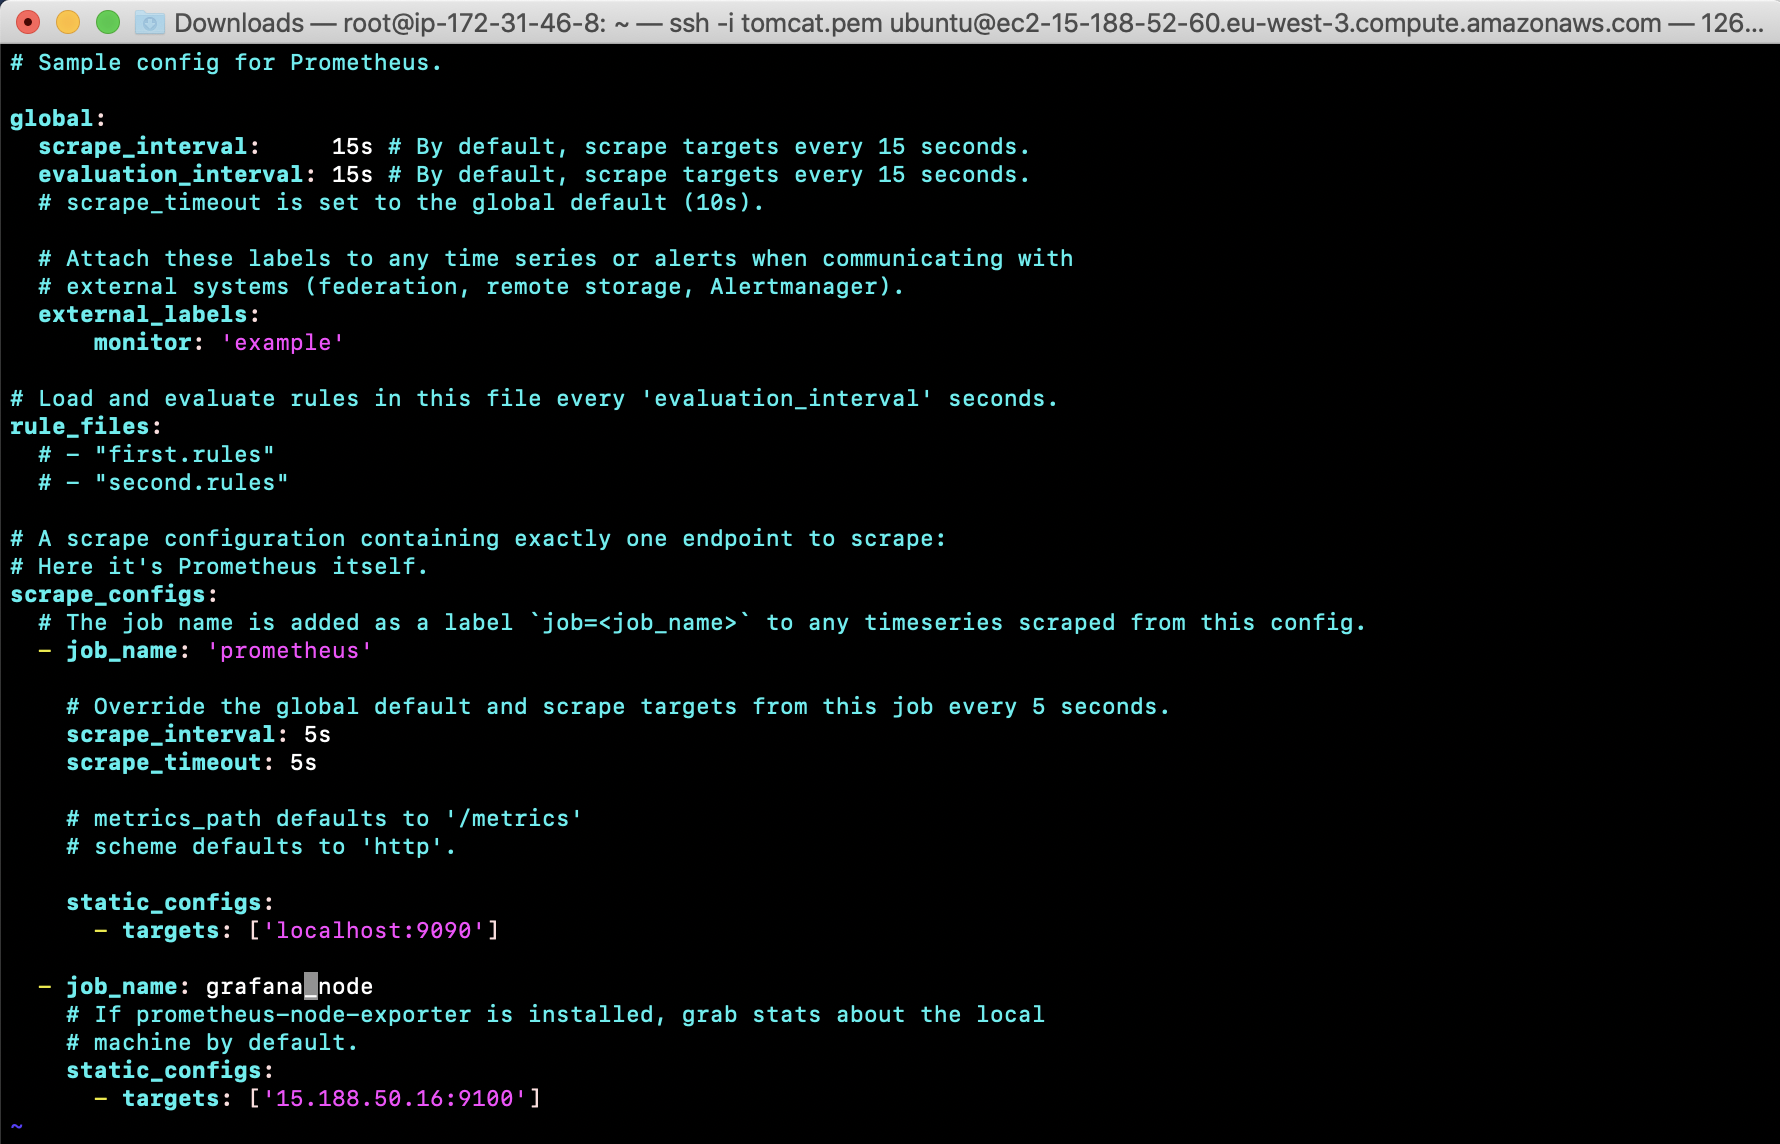
Add the IP of Node_Exporter in Prometheus’s configuration file:
vim /etc/prometheus/prometheus.yml
Restart Prometheus
sudo systemctl start prometheus
Access Prometheus
Execute the “up” query on Prometheus:
http://IP-of-Prometheus:9090/
If the result shows “1”, both localhost and Node_Exporter are up.

Configure Grafana
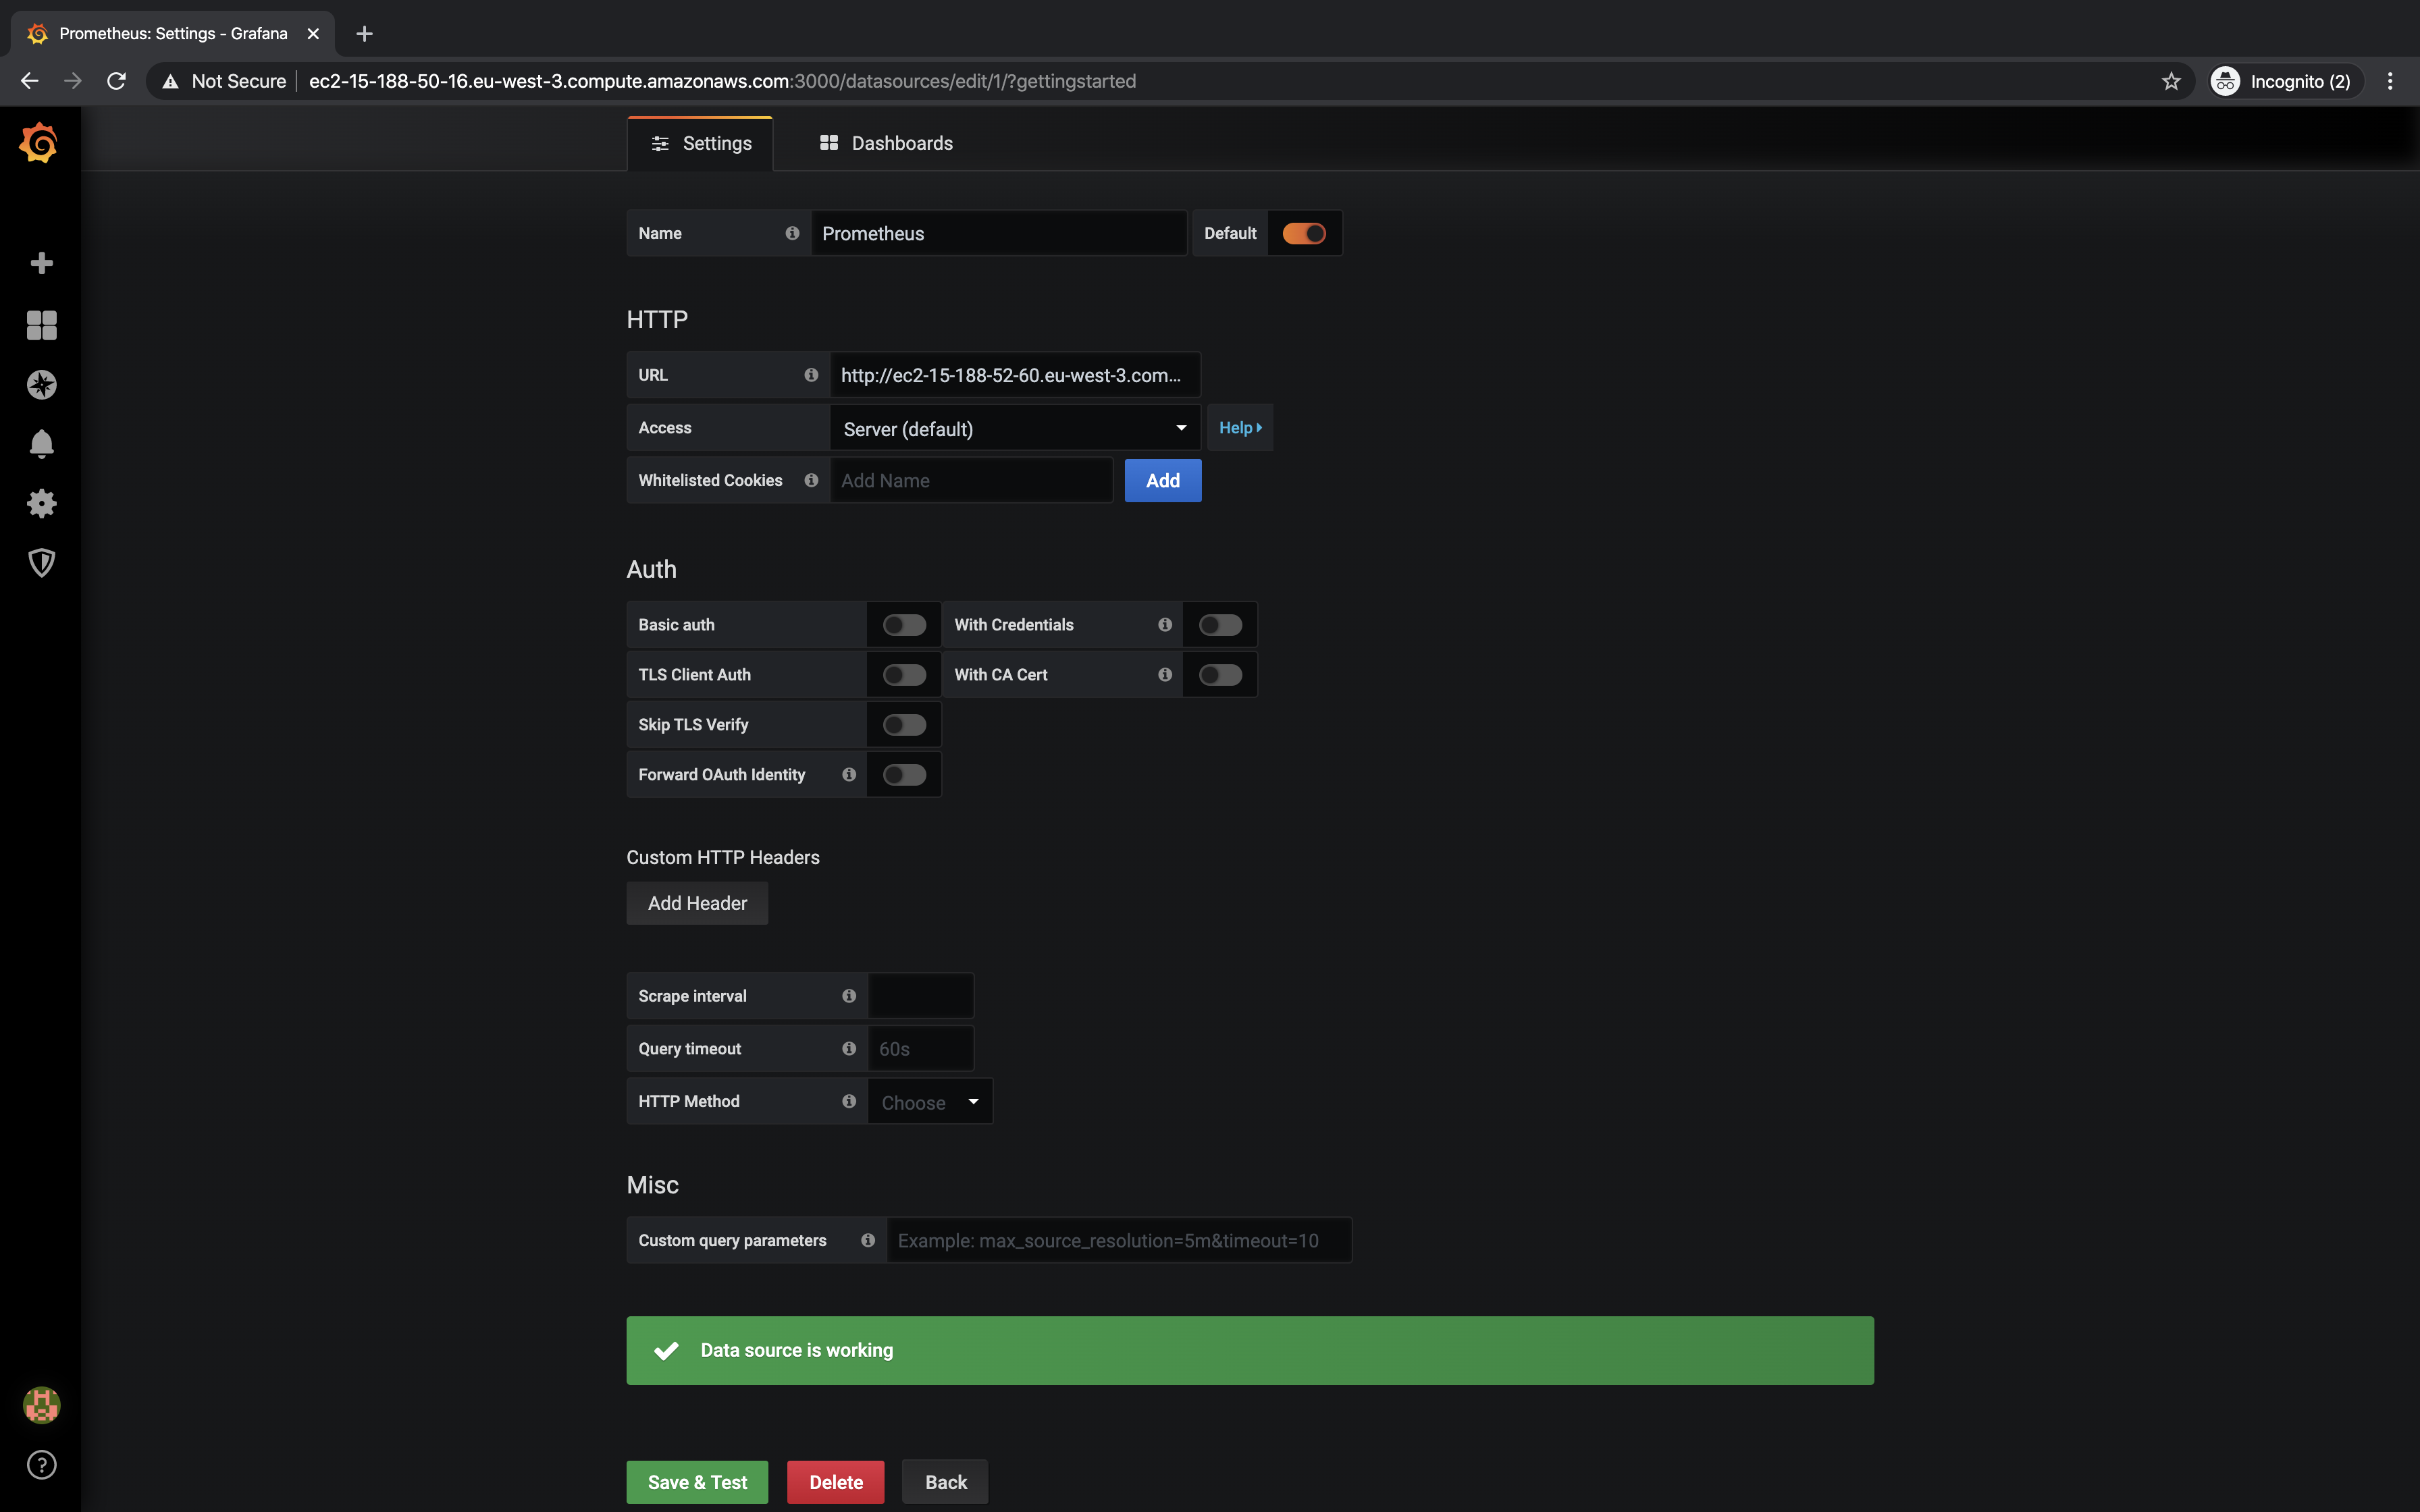
Add Prometheus as a data source in Grafana:
http://Ip-of-Grafana:3000/
Select ‘Add data source’ and then Prometheus.
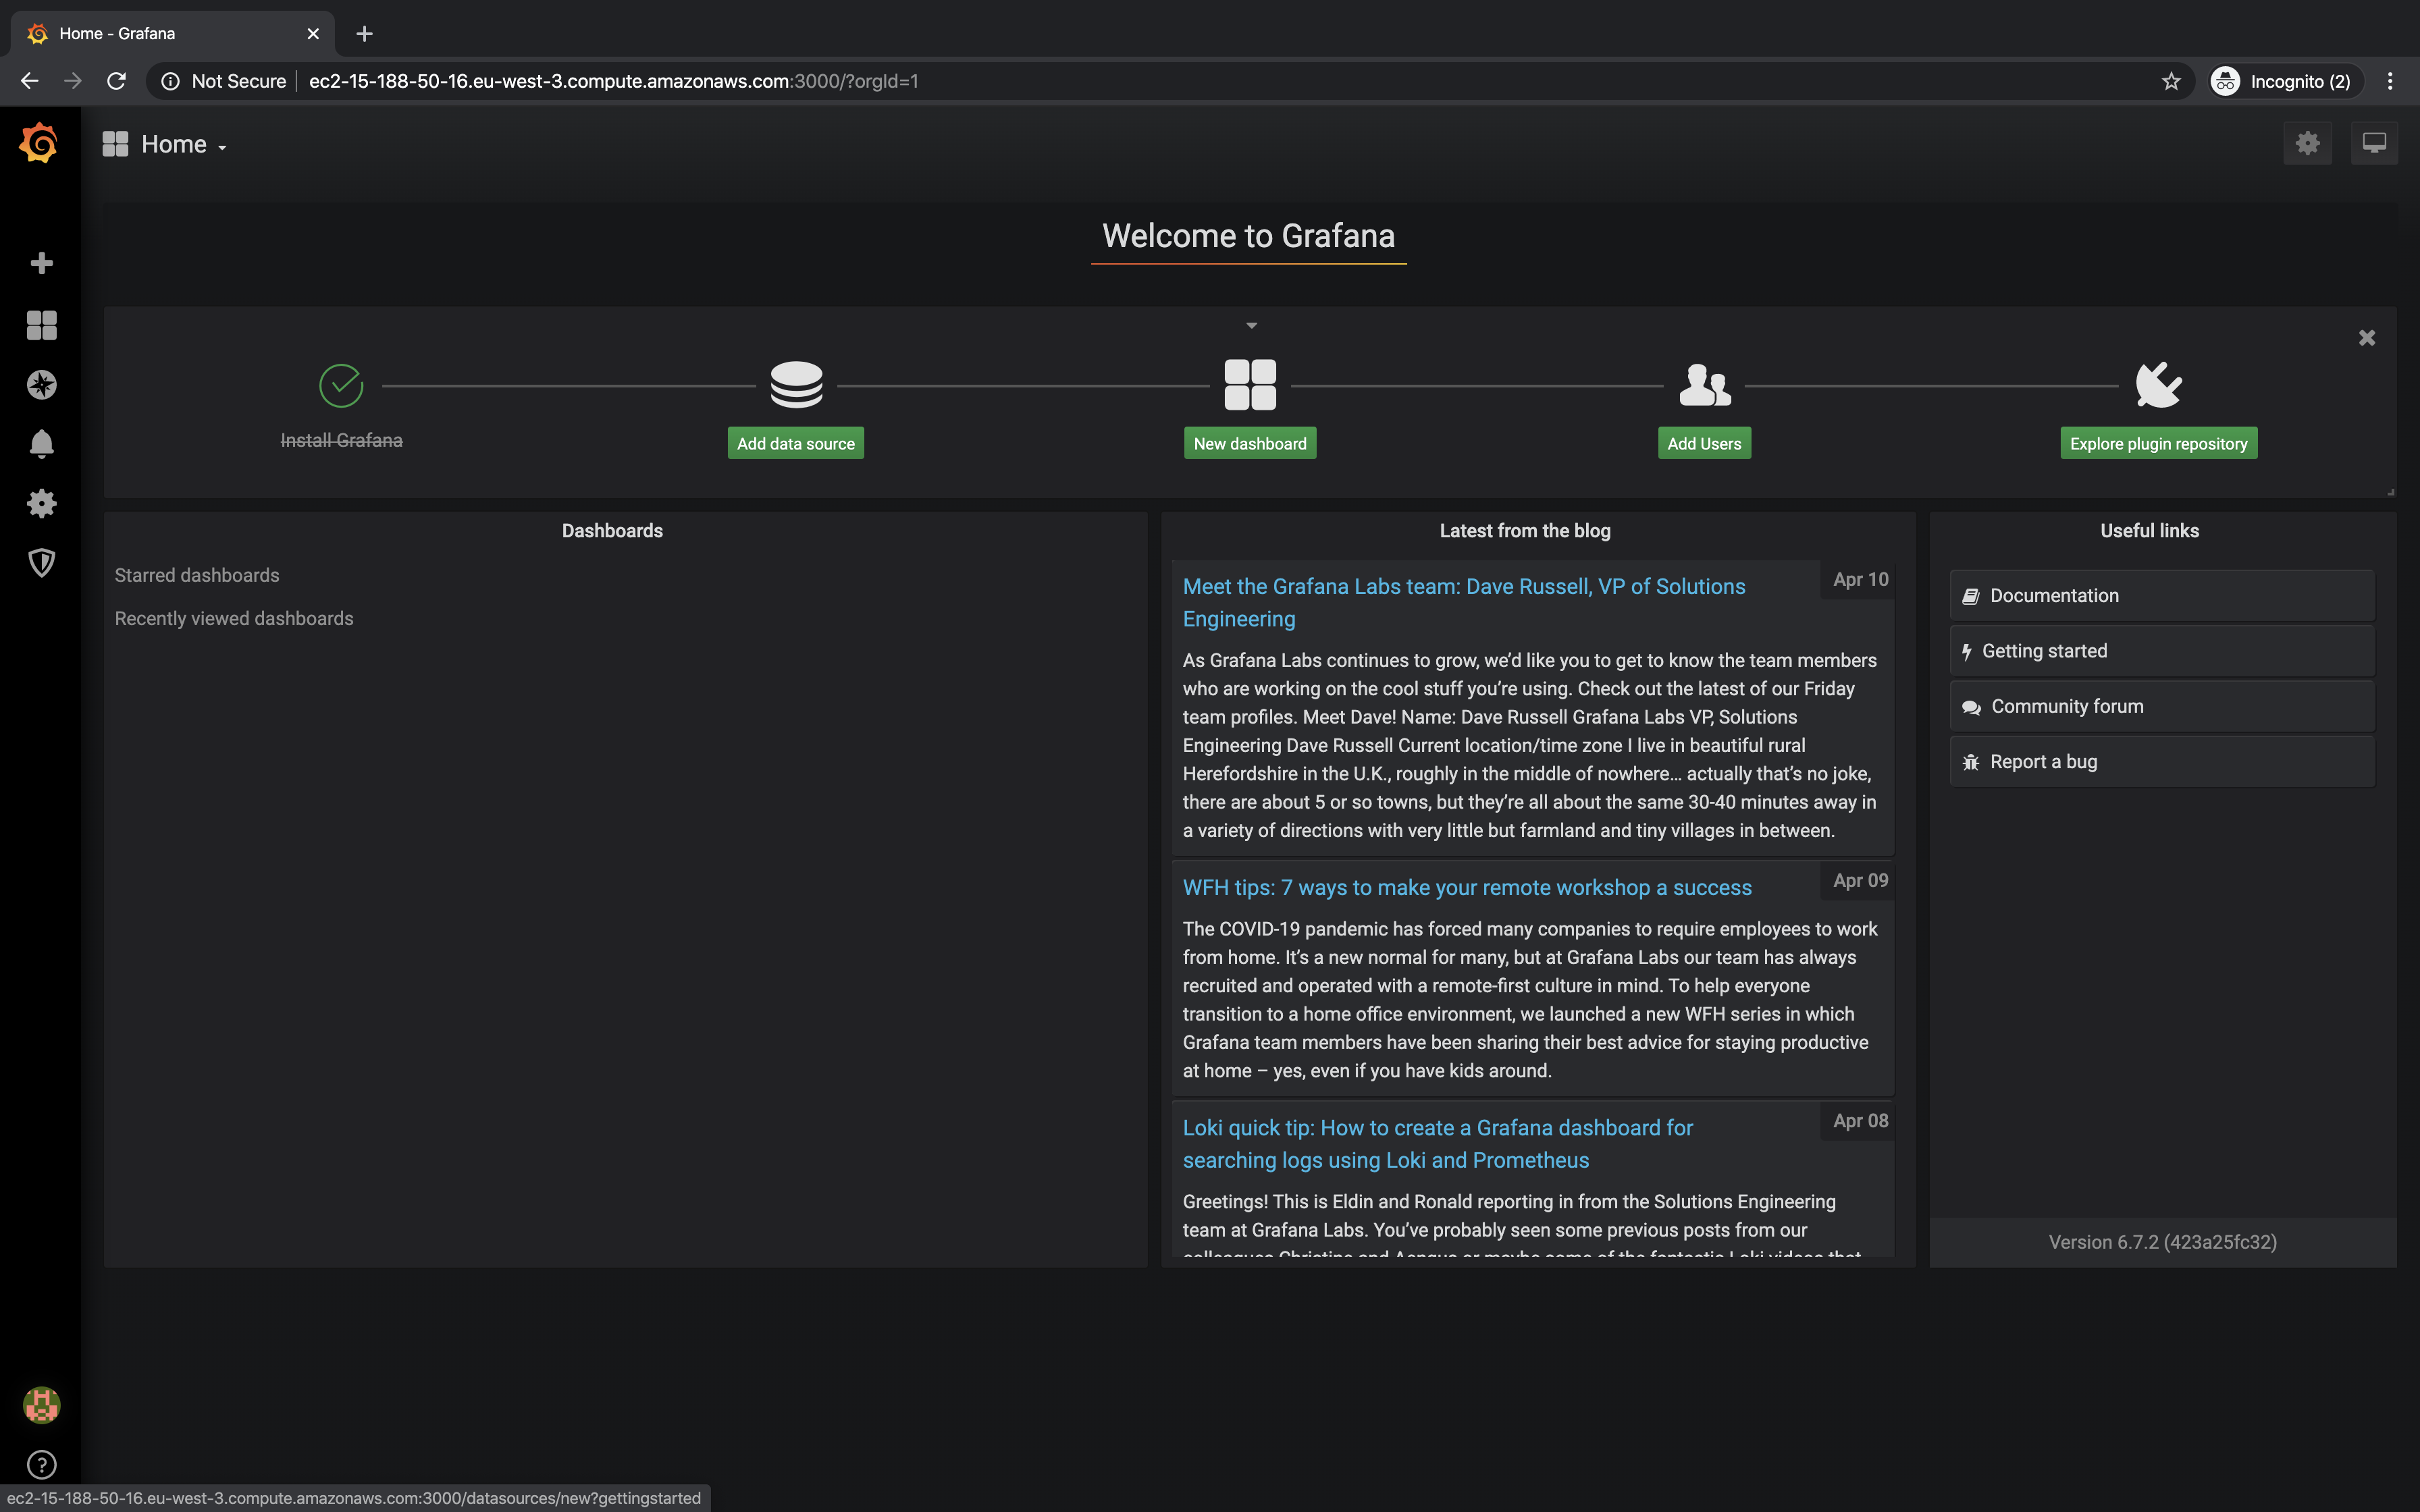
Configure Prometheus URL:
Execute Queries on Grafana
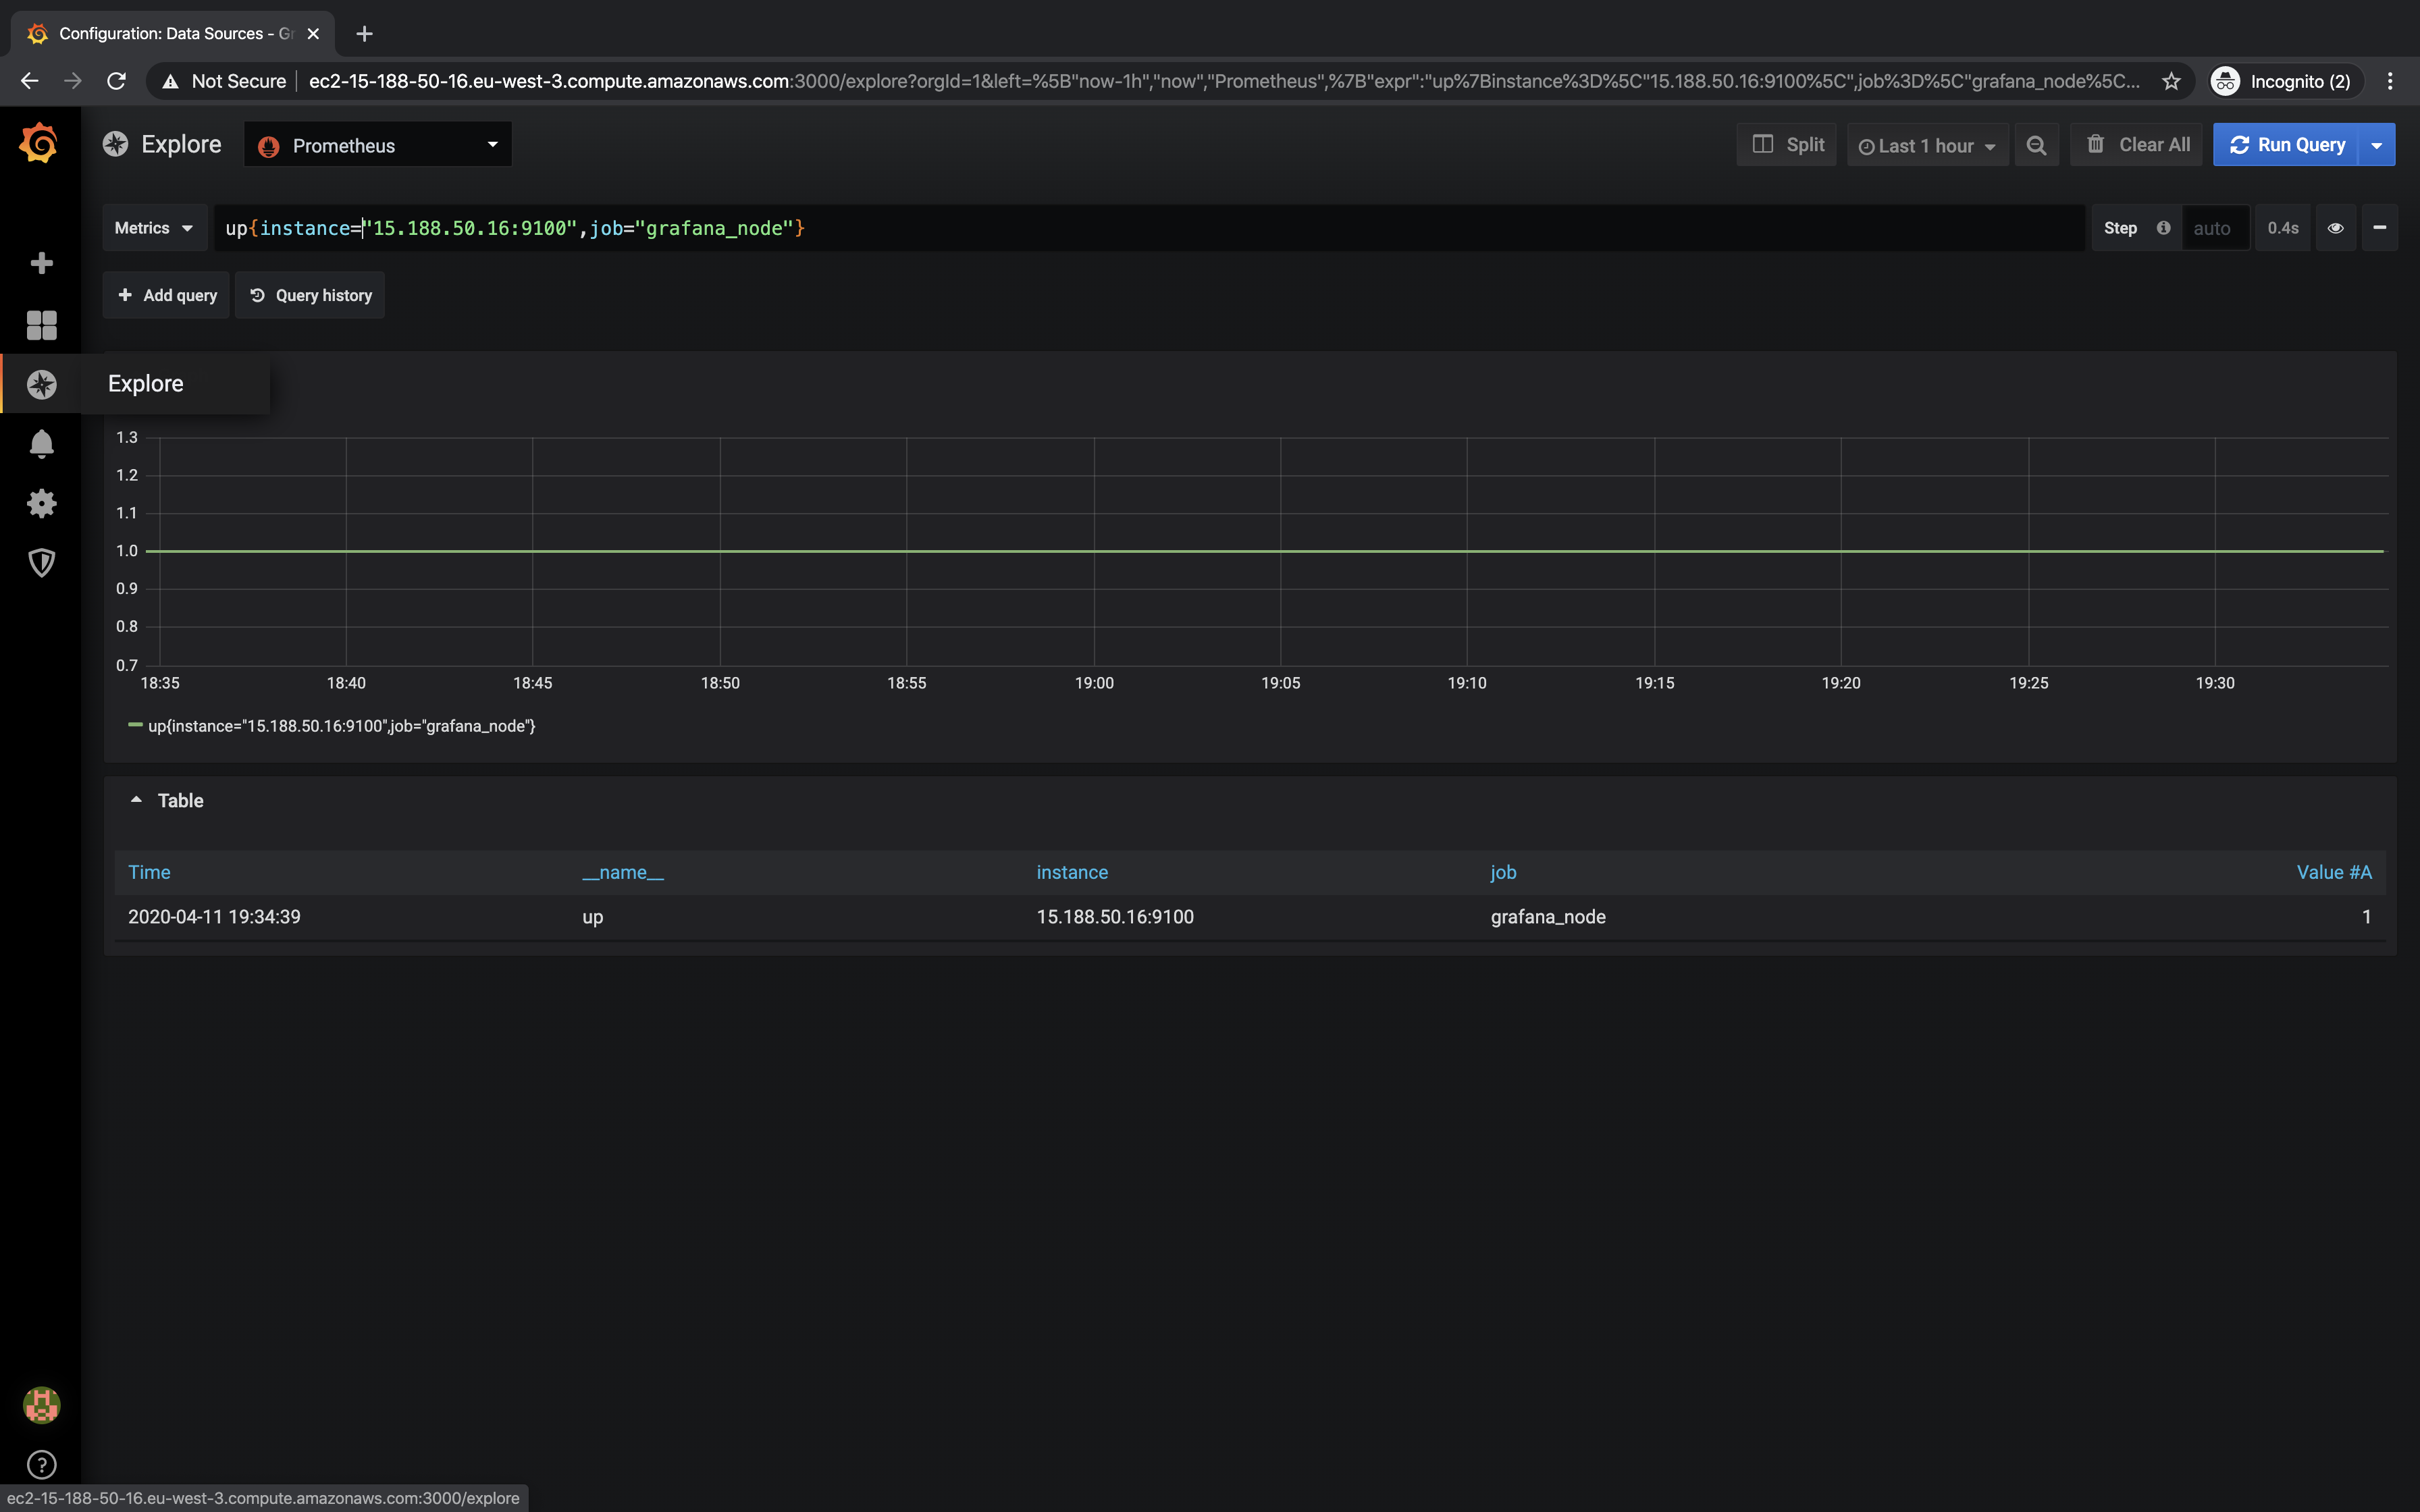
Now, it’s time to run queries on Grafana to check the metrics exported by Node_Exporter.
Example Queries:
-
node_cpu_seconds_total{cpu="0",mode="nice"} -
up{instance="15.188.50.16:9100",job="grafana_node"}
Visualize metrics on Grafana:
Conclusion
This guide detailed the installation and configuration of Prometheus, Grafana, and Node_Exporter on Ubuntu 18.04 LTS. These tools work together to provide robust monitoring and visualization capabilities.
Frequently Asked Questions
- What are the default ports for Prometheus and Grafana?
Prometheus uses port 9090, and Grafana uses port 3000 by default. - How can I secure my Grafana dashboard?
It’s recommended to change the default admin password and enable authentication using LDAP, OAuth, or any other preferred method. - Do I need root privileges for installation?
Yes, root access is required to install these software applications and configure system services. - Can I deploy Grafana and Prometheus on a single server?
Yes, they can be deployed on a single server, especially for smaller environments or testing purposes.