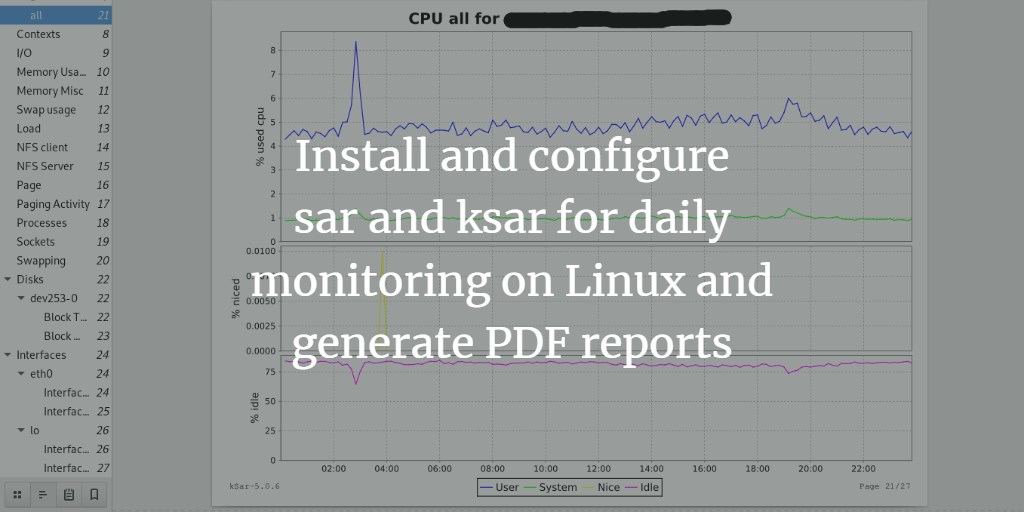
This guide aims to provide a comprehensive tutorial on installing and configuring the powerful utilities, SAR and KSAR, on CentOS, Debian, and Ubuntu. Additionally, it demonstrates how to automate the creation of PDF reports using a simple shell script for efficient daily server resource usage monitoring.
Part 1: Installing SAR Monitoring Software
SAR stands for “System Activity Reports.” It is a lightweight, real-time system monitoring tool that provides detailed reports on resource usage. Default output is on the terminal, and SAR stores information daily, making it a valuable utility for System Administrators.
SAR can be installed on any Linux distribution as part of the sysstat packages.
Install and Configure SAR
For Debian/Ubuntu:
# sudo apt-get install sysstat
For RedHat/CentOS:
# sudo yum install sysstat
To install the latest sysstat from the source:
        wget http://pagesperso-orange.fr/sebastien.godard/sysstat-12.1.4.tar.bz2
        tar -xvf sysstat-12.1.4.tar.bz2
        cd sysstat-12.1.4/
        ./configure --enable-install-cron
        make
        make install
If installed from the source, sysstat will be available under /usr/local/bin/.
After installation, verify the SAR version:
        #sysadmin@Sysadmin:~$ sar -V
        sysstat version 11.2.0
Ensure SAR data collection is enabled:
In Ubuntu:
        #sudo vi /etc/default/sysstat
        ENABLED="true"
Restart SAR service and enable it on startup:
        # systemctl start sysstat
        # systemctl enable sysstat
Verify SAR is working correctly by running:
        [system@redhat ~]$ sar 2 4
        Linux 5.0.16-200.fc29.x86_64 (redhat)    05/22/2019    _x86_64_   (4 CPU)

12:18:13 AM     CPU     %user     %nice   %system   %iowait    %steal     %idle
        12:18:15 AM     all      1.25      0.00      0.50      0.00      0.00     98.24
        12:18:17 AM     all      2.50      0.00      0.38      0.00      0.00     97.12
        12:18:19 AM     all      2.12      0.00      0.62      0.12      0.00     97.12
        12:18:21 AM     all      1.75      0.00      0.50      0.00      0.00     97.75
        Average:       all      1.91      0.00      0.50      0.03      0.00     97.56
To simply run SAR and check resource usage:
        [root@redhat script]# sar
        Linux 5.0.16-200.fc29.x86_64 (redhat)    05/24/2019    _x86_64_   (4 CPU)

12:00:01 AM     CPU     %user     %nice   %system   %iowait    %steal     %idle
        12:10:01 AM     all      4.02      0.05      1.45      1.40      0.00     93.09
        12:20:01 AM     all      6.27      0.02      1.82      0.56      0.00     91.33
        12:30:01 AM     all     10.61      0.03      2.69      0.64      0.00     86.03
        12:40:01 AM     all      9.26      0.05      2.45      0.59      0.00     87.65
By default, the SAR interval is set to every 10 minutes. This can be modified by editing the following file:
vi /etc/cron.d/sysstat
        # Run system activity accounting tool every 10 minutes
        */10 * * * * root /usr/lib64/sa/sa1 1 1
        # 0 * * * * root /usr/lib64/sa/sa1 600 6 &
        # Generate a daily summary of process accounting at 23:53
        53 23 * * * root /usr/lib64/sa/sa2 -A
The above file uses sa1 to collect and store binary data in the system activity daily data file and sa2 to write daily reports in /var/log/sa at the end of the day (23:53 in the above cron job).
Part 2: Installing KSAR
KSAR generates graphs from SAR data, simplifying analysis. Built on Java, KSAR requires JDK 8 or above. Note that KSAR is not part of the system repository and must be downloaded manually.
Install Java on RedHat/CentOS:
sudo yum install java-1.8.0-OpenJDK.x86_64
Download and install KSAR:
        wget https://excellmedia.dl.sourceforge.net/project/ksar/ksar/5.0.6/kSar-5.0.6.zip
        unzip kSar-5.0.6.zip
        cd kSar-5.0.6/
Collect SAR statistics using:
LC_ALL=C sar -A -f /var/log/sa/sa21 > ~/Desktop/sar21
sudo chmod u+x run.sh
sh run.sh &
Ensure you execute the run.sh script as a non-root user to avoid permissions issues.
KSAR will display a user-friendly GUI.
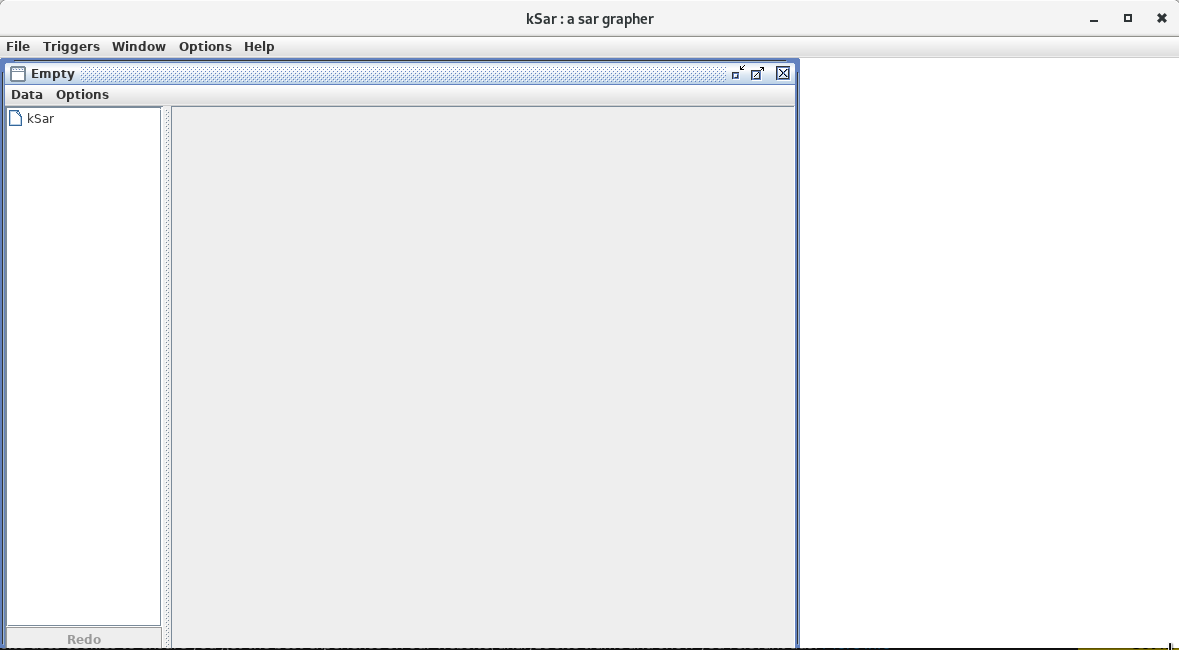
To load a SAR file, click Data → Load from text file, then select ~/Desktop/sar21.
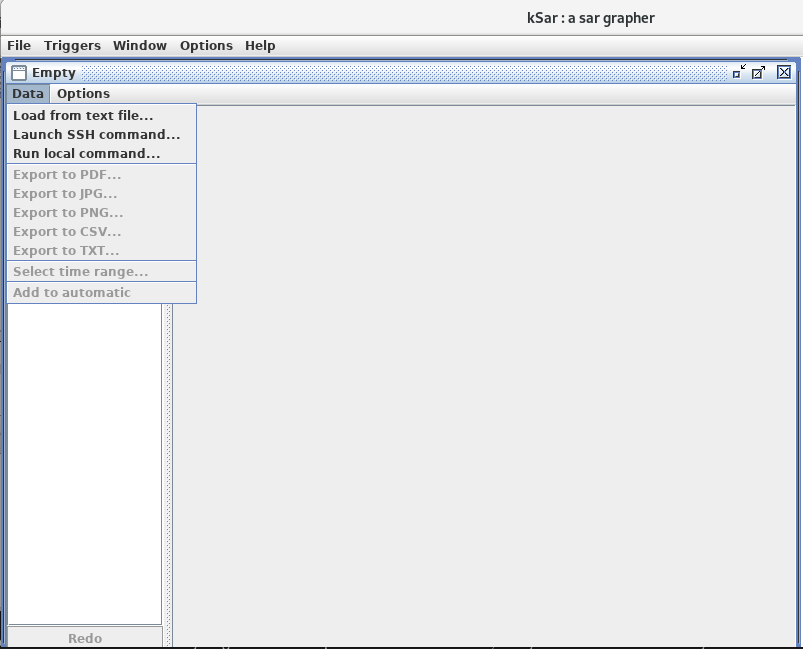
Once loaded, you can export graphs in various formats like PDF, JPG, PNG, CSV, and TXT. For PDF, select all desired values during export.
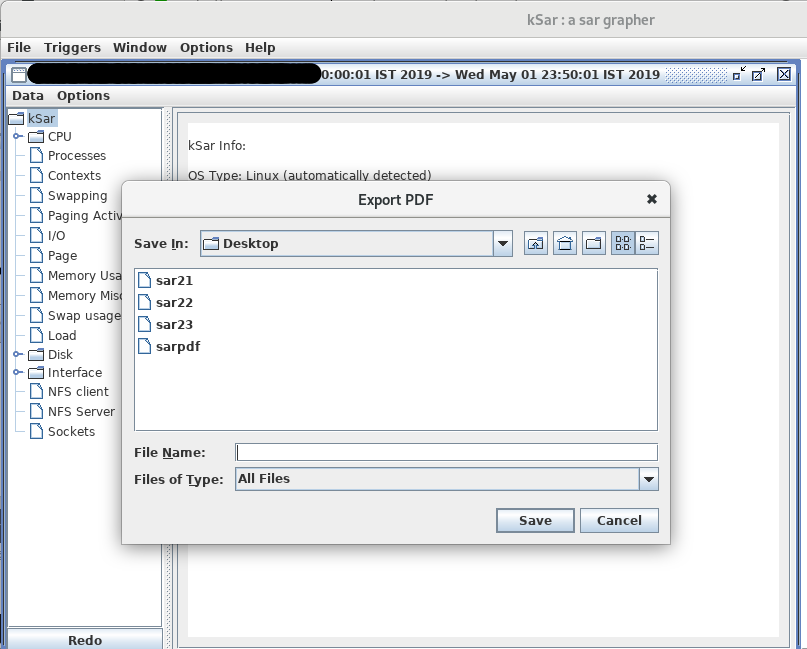
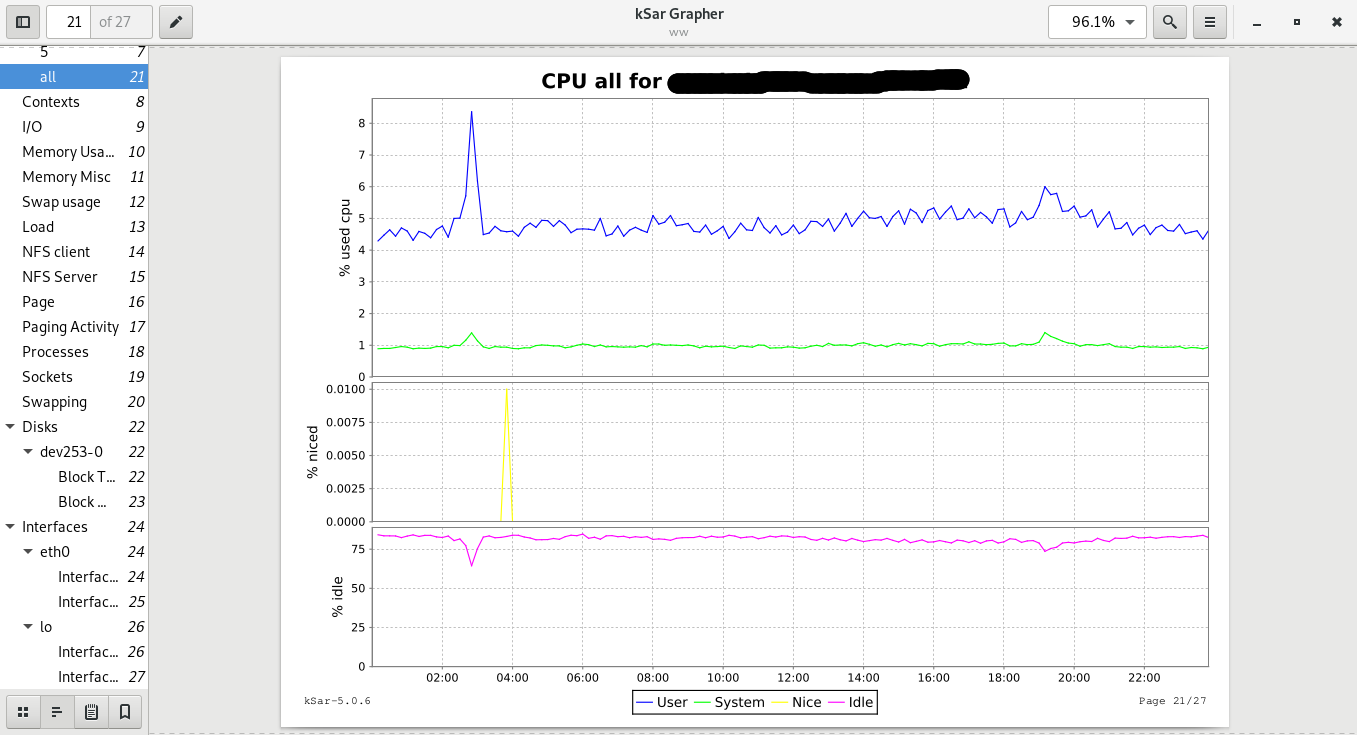
Opening the PDF will display useful server resource information.
For example, CPU load over a day:
Memory usage over a day:
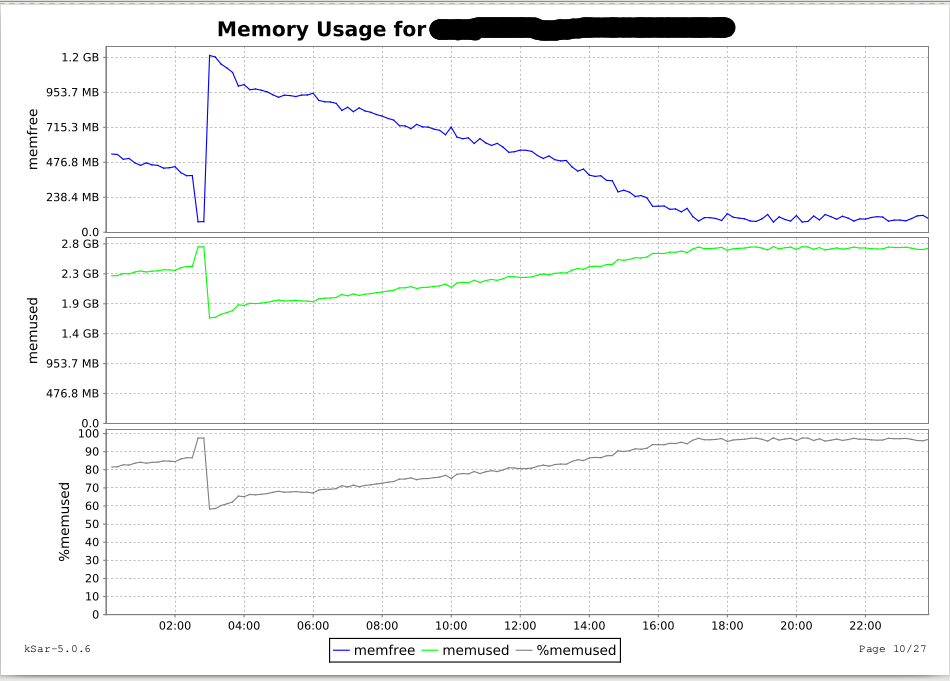
This allows you to easily generate graphs for CPU, memory, processing, I/O, swap, sockets, and many other system resources for daily monitoring tasks.
Part 3: The Monitoring Script
KSAR’s GUI is user-friendly, but a script automates KSAR graph generation, saving time.
Create a script for daily graph generation:
vi sar_script.sh
        #!/bin/bash
        i=`date --date="1 days ago" +%d`
        LC_ALL=C sar -A -f /var/log/sa/sa$i > /home/admin/sar_report/sardaily_report$i
        cd /home/soham/Downloads/kSar-5.0.6/
        java -jar kSar.jar -input /home/admin/sar_report/sardaily_report$i -outputPDF /home/admin/sar_report/sardaily$(date --date="1 days ago" +%b)$i.pdf
        echo "KSAR graph successfully generated"
sudo chmod u+x sar_script.sh
Use cron to automate the PDF graph generation:
crontab -e
* 10 * * * /bin/sh /home/admin/script/sar_script.sh
This cron job generates a PDF graph from SAR data daily at 10 AM.
For monthly SAR statistics report generation:
#!/bin/bash

function sar_value(){
    #This is set for 31 possible days.
for i in 1 2 3 4 5 6 7 8 9 10 11 12 13 14 15 16 17 18 19 20 21 22 23 24 25 26 27 28 29 30 31; do
    LC_ALL=C sar -A -f /var/log/sa/sa$i >> /home/admin/sar_report/sarmonthly$(date --date="1 days ago" +%b).txt
done
}
Function for script
sar_value
Generate a PDF graph from the monthly SAR statistics text file:
java -jar kSar.jar -input /home/admin/sar_report/sarmonthly$(date --date="1 days ago" +%b).txt -outputPDF /home/admin/sar_report/sar_monthly.pdf
This generates the entire month’s report in a single PDF file.
Use the same cron setup for automation as shown earlier. To directly send KSAR graphs from the server to a local PC, set up passwordless SSH between the server and local PC, and add rsync to the script for automation.
By utilizing the powerful SAR utility, you can significantly enhance the effectiveness of daily system monitoring tasks.
Frequently Asked Questions (FAQ)
- What is SAR? – SAR stands for System Activity Report, a tool to monitor the performance of various system resources in real-time.
- What is KSAR? – KSAR is a Java-based tool that generates graphs from SAR data for easier analysis.
- Can KSAR be used without a user interface? – Yes, KSAR can generate graphs via command-line scripts without a UI.
- Is KSAR available in system repositories? – No, KSAR needs to be downloaded and installed manually.
- Should the KSAR script be run as root? – It is recommended to execute the KSAR script as a non-root user to avoid permissions issues.
