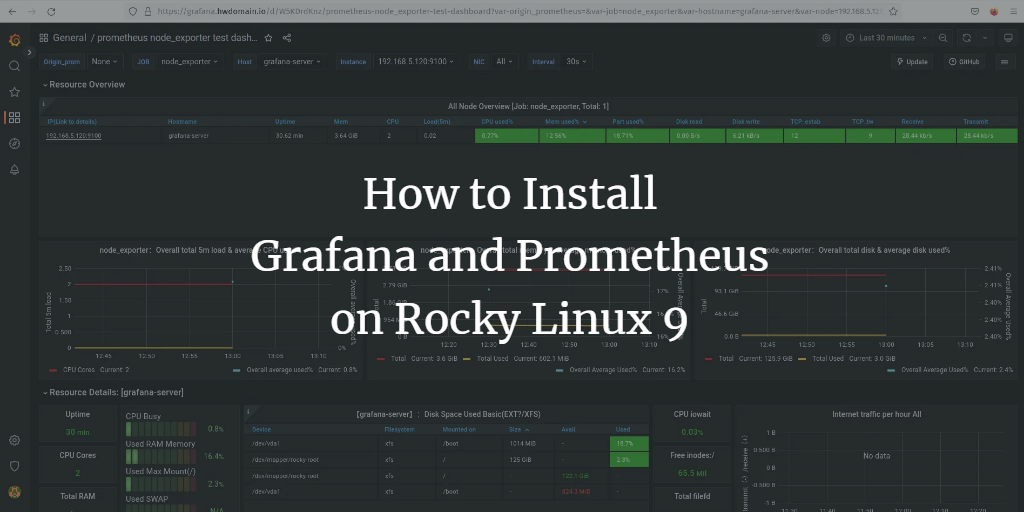
Grafana is an open-source, multi-platform data visualization platform developed by Grafana Labs. It provides an interactive web application featuring charts, graphs, and alerts, enabling users to query, visualize, set up alerts, and explore metrics, logs, and traces of time-series databases (TSDB). Using Grafana, users can turn TSDB data into insightful graphs and visualizations.
You can add time-series database data to Grafana via its ‘Data Source’ feature, which supports multiple data sources like Prometheus, InfluxDB, PostgreSQL, Loki, Jaeger, Graphite, Google Cloud Monitoring, AWS CloudWatch, Azure Monitor, and many others.
This tutorial will guide you through the installation of the Grafana open-source analytics and visualization web application with Nginx configured as a reverse proxy. We will also install and set up Prometheus for system monitoring, using Node Exporter to gather system metrics. Finally, we will integrate Prometheus as a data source in Grafana and establish a dashboard for system monitoring.
This tutorial applies to installations on a Rocky Linux 9 server.
Prerequisites
Ensure you have the following prerequisites before starting this guide:
- A Rocky Linux 9 server: You can choose to experiment with one or multiple servers as follows:
- Single server: Grafana, Prometheus, and Node Exporter on one server.
- Two servers: Grafana on Server1, with Prometheus and Node Exporter on Server2.
- Three servers: Grafana on Server1, Prometheus on Server2, and Node Exporter on Server3.
- A non-root user with sudo/root administrative privileges.
Installing Grafana
Grafana can be installed on multiple operating systems, including Windows, Linux, and macOS. This guide focuses on installing Grafana on a Rocky Linux 9 server by utilizing the provide RHEL-based repository.
Before adding the Grafana repository, update the default crypto policy to ‘SHA1’ and reboot your server:
sudo update-crypto-policies --set DEFAULT:SHA1
sudo reboot
Upon logging back in, create a new repository file /etc/yum.repos.d/grafana.repo using the nano editor:
sudo nano /etc/yum.repos.d/grafana.repo
Add the following content:
[grafana]
name=grafana
baseurl=https://rpm.grafana.com
repo_gpgcheck=1
enabled=1
gpgcheck=1
gpgkey=https://rpm.grafana.com/gpg.key
sslverify=1
sslcacert=/etc/pki/tls/certs/ca-bundle.crt
Save, exit the editor, and verify that the repository list includes Grafana:
sudo dnf repolist

Install Grafana using the dnf command:
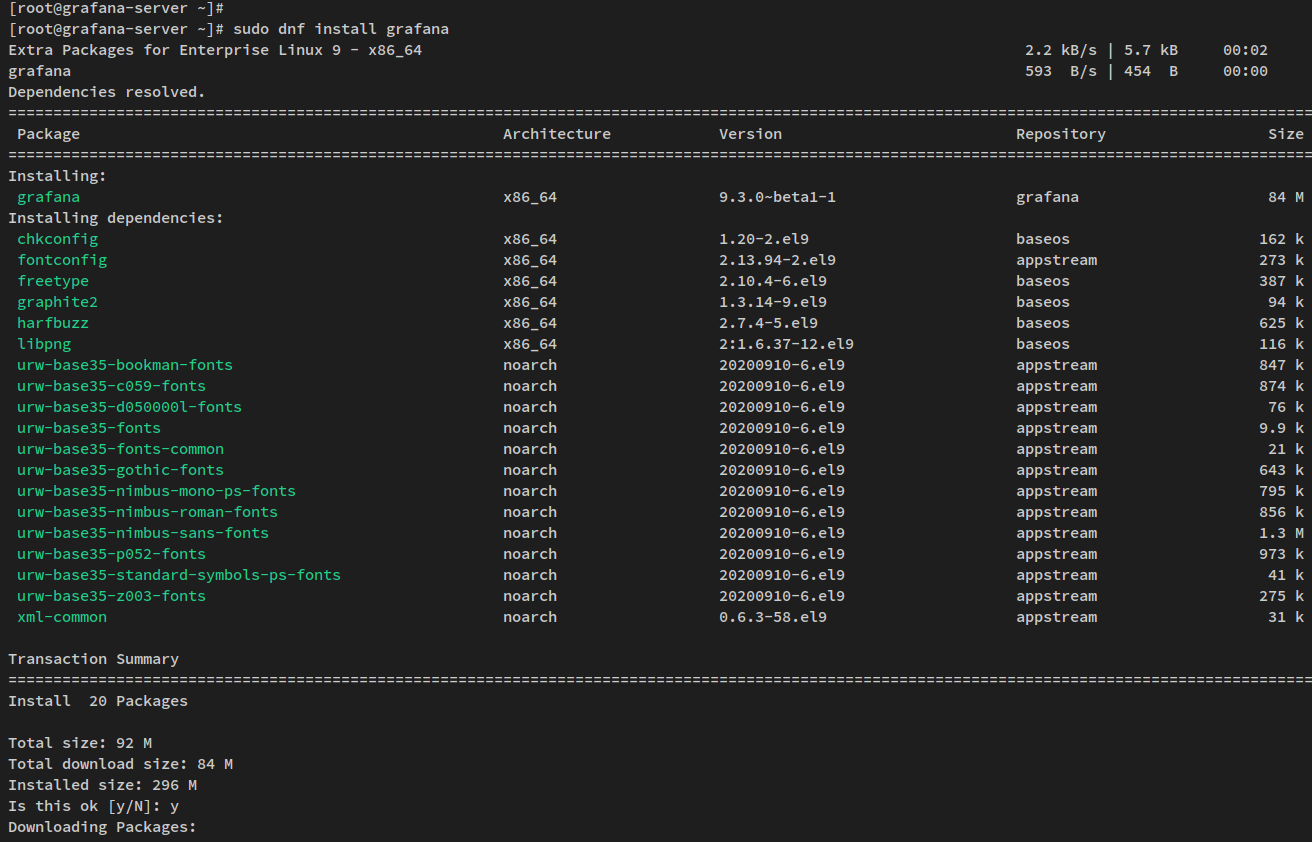
sudo dnf install grafana
Approve installation and gpg key as prompted:

Post-installation, reload systemd, start and enable Grafana:
sudo systemctl daemon-reload
sudo systemctl start grafana-server
sudo systemctl enable grafana-server

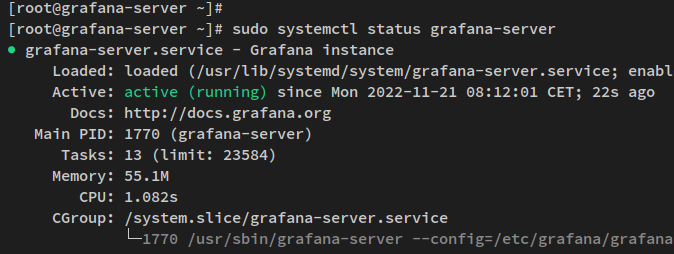
Verify the Grafana server’s active status:
sudo systemctl status grafana-server
Configuring Grafana
Configure Grafana after installation by editing /etc/grafana/grafana.ini to restrict it to localhost and set a local domain:
sudo nano /etc/grafana/grafana.ini
Modify the server block as follows:
[server]
# The IP address to bind to, empty will bind to all interfaces
http_addr = localhost
# The http port to use
http_port = 3000
# The public facing domain name used to access grafana from a browser
domain = grafana.howtoforge.local
Save, close the editor, and restart Grafana:
sudo systemctl restart grafana-server
Setting up Nginx as a Reverse Proxy
To serve Grafana through a web domain, install and configure Nginx as a reverse proxy:
sudo dnf install nginx
Configure Nginx with:
sudo nano /etc/nginx/conf.d/grafana.conf
Insert the server block configuration:
# this is required to proxy Grafana Live WebSocket connections.
map $http_upgrade $connection_upgrade {
  default upgrade;
  '' close;
}
server {
listen      80;
server_name grafana.howtoforge.local;
rewrite     ^   https://$server_name$request_uri? permanent;
}

server {
listen      443 ssl http2;
server_name grafana.howtoforge.local;

root /usr/share/nginx/html;
index index.html index.htm;

ssl_certificate /etc/letsencrypt/live/grafana.howtoforge.local/fullchain.pem;
ssl_certificate_key /etc/letsencrypt/live/grafana.howtoforge.local/privkey.pem;

access_log /var/log/nginx/grafana-access.log;
error_log /var/log/nginx/grafana-error.log;

location / {
proxy_set_header Host $http_host;
proxy_pass http://localhost:3000/;
}

# Proxy Grafana Live WebSocket connections.
location /api/live {
rewrite  ^/(.*)  /$1 break;
proxy_http_version 1.1;
proxy_set_header Upgrade $http_upgrade;
proxy_set_header Connection $connection_upgrade;
proxy_set_header Host $http_host;
proxy_pass http://localhost:3000/;
}
}
Save and verify the configuration:
sudo nginx -t
Start and enable nginx:
sudo systemctl start nginx
sudo systemctl enable nginx

Check Nginx’s status:
sudo systemctl status nginx

Open HTTP and HTTPS protocols in the firewall:
sudo firewall-cmd --add-service={http,https} --permanent
sudo firewall-cmd --reload
sudo firewall-cmd --list-services

Access Grafana by visiting your domain name (https://grafana.howtoforge.local) and use the default login credentials (admin/admin). After logging in, you will be asked to set a new password.
Installing Prometheus and Node Exporter
Prometheus is a system monitoring and alerting toolkit. Node Exporter is a Prometheus hardware and OS metrics exporter. To install Prometheus and Node Exporter:
Create Prometheus repository file:
sudo nano /etc/yum.repos.d/prometheus.repo
Add repository details:
[prometheus]
name=prometheus
baseurl=https://packagecloud.io/prometheus-rpm/release/el/$releasever/$basearch
repo_gpgcheck=1
enabled=1
gpgkey=https://packagecloud.io/prometheus-rpm/release/gpgkey
       https://raw.githubusercontent.com/lest/prometheus-rpm/master/RPM-GPG-KEY-prometheus-rpm
gpgcheck=1
metadata_expire=300
Verify repository presence:
sudo dnf repolist

Install Prometheus and Node Exporter:
sudo dnf install prometheus2 node_exporter
Upon approval, the installation will begin:


Start and enable both services:
sudo systemctl start prometheus node_exporter
sudo systemctl enable prometheus node_exporter
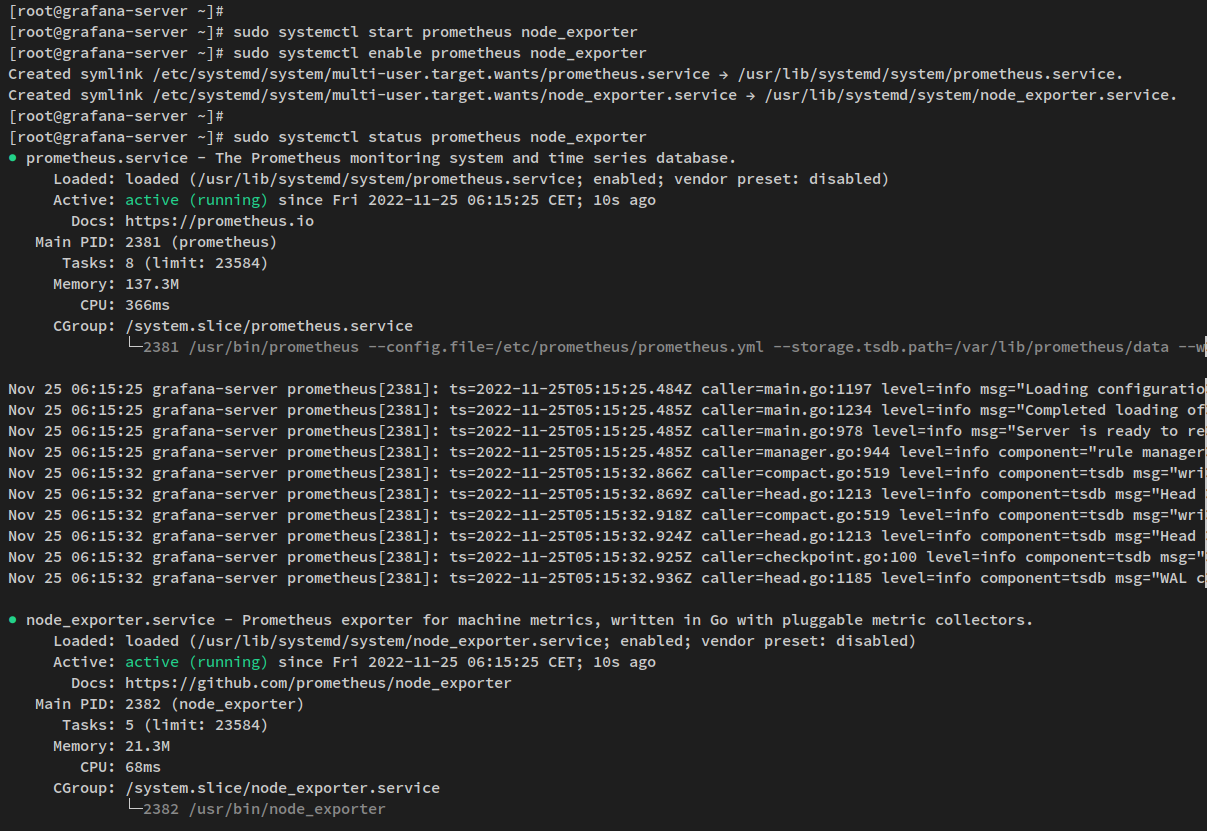
Verify service status:
sudo systemctl status prometheus node_exporter
Add firewall rules for Prometheus and Node Exporter ports:
sudo firewall-cmd --add-port={9090/tcp,9100/tcp} --permanent
sudo firewall-cmd --reload
Configuring Prometheus and Node Exporter
After installation, configure Prometheus and Node Exporter for enhanced security and functionality:
- Enable basic authentication for Prometheus.
- Enable HTTPS/SSL for secure communication.
- Set up
scrape_configfor target machines.
Enable Basic Authentication and SSL for Prometheus
Install the ‘httpd-tools’ to generate password:
sudo dnf install httpd-tools -y
Generate a bcrypt password with htpasswd:
htpasswd -nB promadmin

Create /etc/prometheus/web.yml for Prometheus configuration:
sudo nano /etc/prometheus/web.yml
Add necessary authentication and SSL settings:
# tls certificates
tls_server_config:
  cert_file: fullchain.pem
  key_file: privkey.pem
# basic_auth
basic_auth_users:
promadmin: $2y$05$.OhemZb5HtMYsHSBdrH4/.74FKCL2NbD2I41FI5L/VO.Uy6c2dQ7i
Edit /etc/default/prometheus to apply the web configuration:
sudo nano /etc/default/prometheus
--web.config.file=/etc/prometheus/web.yml
Configure scrape_config for Targets
Edit Prometheus configuration at /etc/prometheus/prometheus.yml:
sudo nano /etc/prometheus/prometheus.yml
Modify scrape_configs section:
scrape_configs:
  # The job name is added as a label `job=<job_name>` to any timeseries scraped from this config.
  - job_name: "prometheus"
# metrics_path defaults to '/metrics'
# scheme defaults to 'http'.
# add settings for certificate and authentication
scheme: https
tls_config:
cert_file: /etc/prometheus/server.crt
key_file: /etc/prometheus/server.key
# if using self-signed certificate, set [true]
insecure_skip_verify: true
basic_auth:
username: 'promadmin'
password: 'password'

static_configs:
# if using a valid certificate, set the same hostname in the certificate
- targets: ["localhost:9090"]

- job_name: "node_exporter"

static_configs:
- targets: ["192.168.5.120:9100"]
Restart both services to apply changes:
sudo systemctl restart prometheus node_exporter
Adding Prometheus as a Data Source to Grafana
To integrate Prometheus with Grafana for comprehensive monitoring:
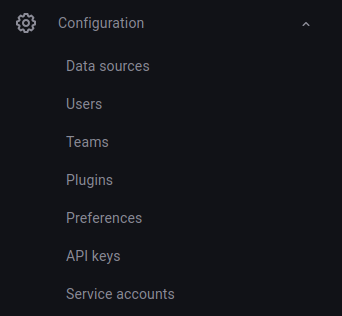
Navigate to Configuration > Data Sources in the Grafana dashboard:
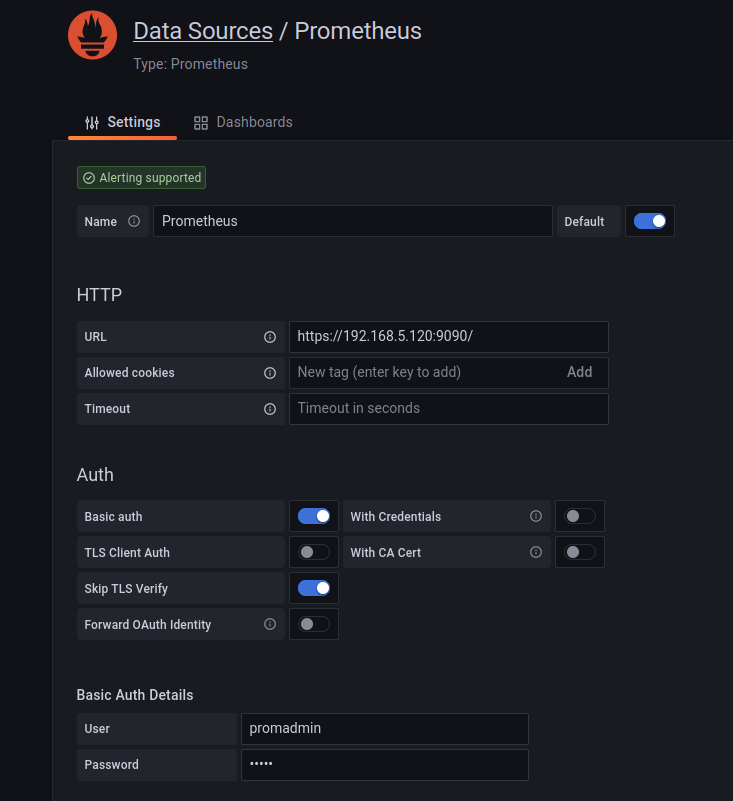
Select Prometheus and input the necessary details, ensuring to enable Basic auth and TLS verification if required:
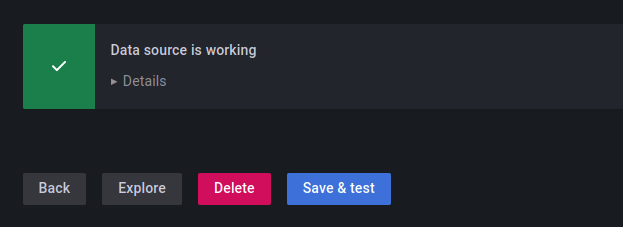
Complete the setup by clicking Save & Test:
Setting up a Dashboard for Monitoring
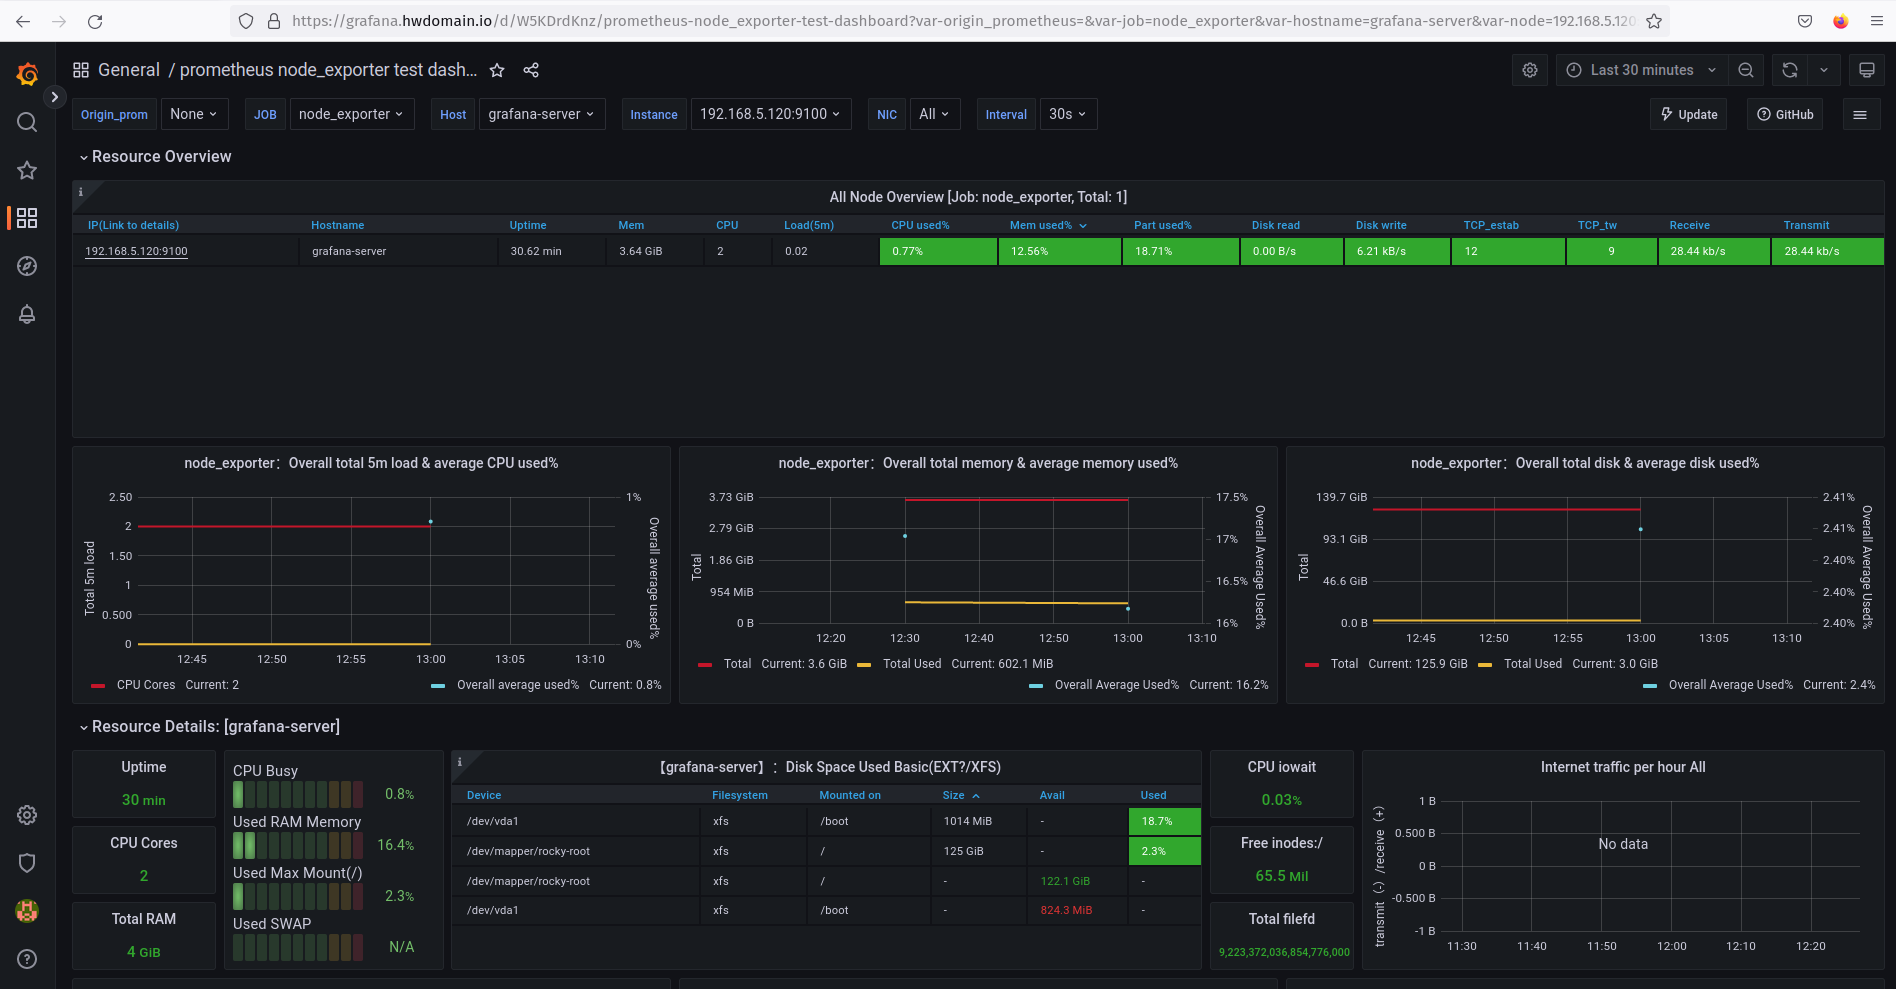
After adding Prometheus to Grafana, set up a dashboard for monitoring:
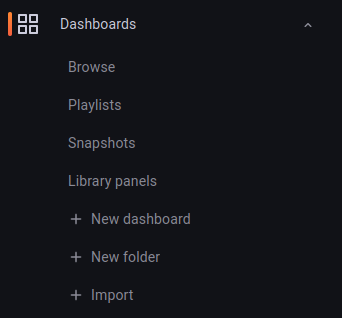
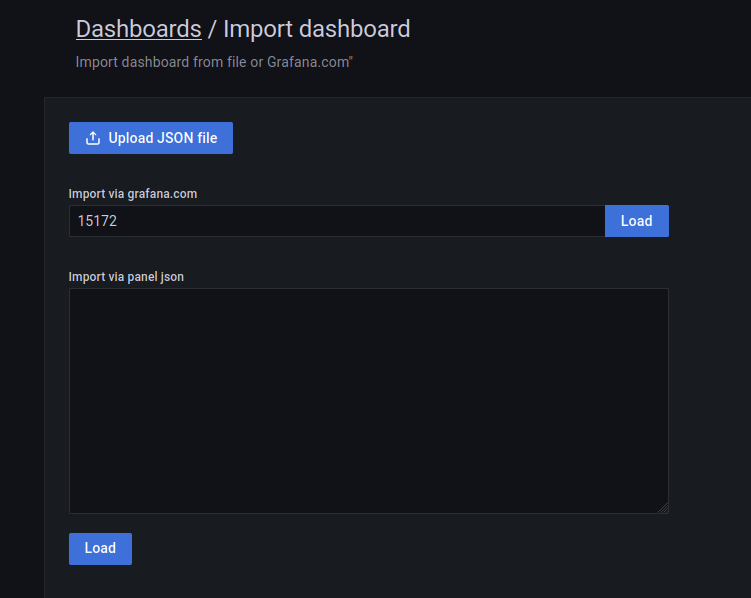
On the dashboard page, navigate to Dashboard > Import:
Download dashboards from the Grafana Dashboard repository, and for this example, use dashboard ID 15172:
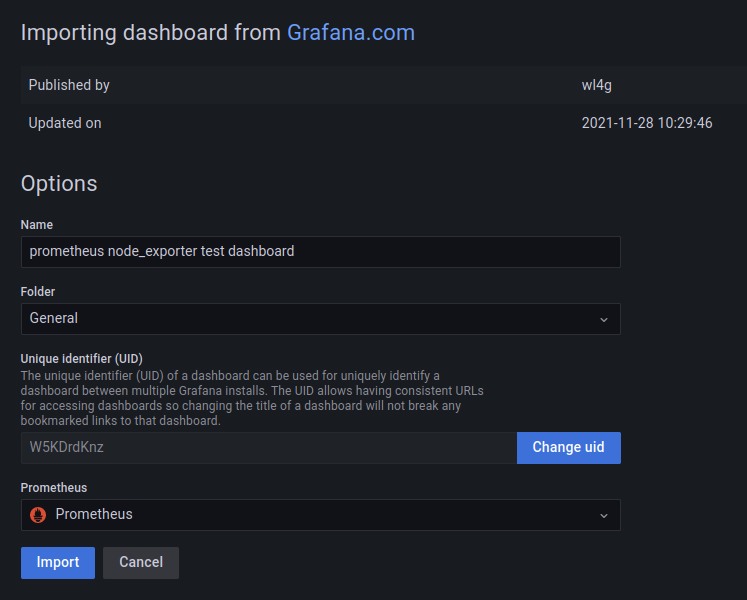
Select Prometheus as the data source and complete the process by clicking Import:
Conclusion
This tutorial detailed the installation and configuration of Grafana with Nginx as a reverse proxy on Rocky Linux 9. Additionally, it covered installing Prometheus with Node Exporter, integrating Prometheus with SSL and basic authentication, as well as setting it up as a data source in Grafana for real-time system monitoring.
Explore further by adding more exporters to your applications and visualizing the data using Grafana dashboards.
Frequently Asked Questions
- What is Grafana used for?
- Grafana is used for data visualization and analytical monitoring of metrics, logs, and traces collected from a variety of data sources.
- How do you add a data source in Grafana?
- Navigate to Configuration > Data Sources in Grafana’s dashboard. Click on “Add data source,” select the type, and input necessary configuration details.
- Why use Nginx as a reverse proxy for Grafana?
- Nginx enhances security by handling SSL/TLS certificates and serves as a buffer in front of Grafana, improving performance.
- Is Prometheus secure by default?
- No, Prometheus does not have built-in security features by default, but you can enable basic authentication and SSL/TLS manually.
- Can Grafana function without Prometheus?
- Yes, Grafana supports a multitude of data sources aside from Prometheus, like InfluxDB, Elasticsearch, and many more.
