In this tutorial, we will learn how to install Prometheus on Ubuntu 20.04. For those unfamiliar with Prometheus, it is a robust system monitoring tool that provides an overview of your system’s metrics and performance information, helping you identify any problems or bottlenecks. It is particularly useful for tracking resources like CPU usage, memory utilization, and network I/O wait time. Prometheus also features a web interface for seamless monitoring from any device with an internet connection and supports alerting via email and SMS when metrics exceed configured thresholds.
Prerequisites
- A server running Ubuntu 20.04 LTS with at least 2GB of RAM and 1 vCPU.
- Log in as root or a non-root user with sudo privileges.
Install Nginx
Start by updating your repository with the following command:
sudo apt update
This update is important to avoid potential issues with package installations later on. After updating, install Nginx using the command below:
sudo apt install nginx
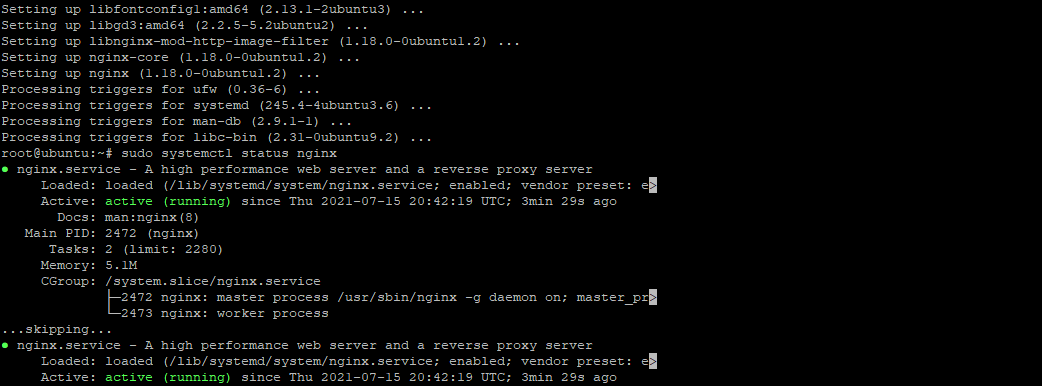
Check if the Nginx service is running by executing:
sudo systemctl status nginx
If Nginx is running, your output will be similar to the image below:

If it’s not running, start Nginx with:
sudo systemctl start nginx
Create Prometheus System User
Create a service user account for Prometheus with the following commands:
sudo useradd --no-create-home --shell /bin/false prome
sudo useradd --no-create-home --shell /bin/false node_exporter
Create Prometheus Directories
Create directories to store configuration files and other data:
sudo mkdir /etc/prometheus
sudo mkdir /var/lib/prometheus
Downloading and Installing Prometheus
Download Prometheus using wget:
wget https://github.com/prometheus/prometheus/releases/download/v2.28.1/prometheus-2.28.1.linux-amd64.tar.gz
Extract the binary with:
tar -xvf prometheus-2.28.1.linux-amd64.tar.gz
Copy the binaries to the appropriate directory:
sudo cp prometheus-2.28.1.linux-amd64/prometheus /usr/local/bin/
sudo cp prometheus-2.28.1.linux-amd64/promtool /usr/local/bin/
Change ownership of these files:
sudo chown prome:prome /usr/local/bin/prometheus
sudo chown prome:prome /usr/local/bin/promtool
Copy configuration directories:
sudo cp -r prometheus-2.28.1.linux-amd64/consoles /etc/prometheus
sudo cp -r prometheus-2.28.1.linux-amd64/console_libraries /etc/prometheus
Change file ownership:
sudo chown -R prome:prome /etc/prometheus/consoles
sudo chown -R prome:prome /etc/prometheus/console_libraries
Create Prometheus Configuration File
Create the main configuration file:
sudo nano /etc/prometheus/prometheus.yml
Enter the following configuration:
global:
  scrape_interval: 15s
scrape_configs:
  - job_name: 'prometheus'
    scrape_interval: 5s
    static_configs:
      - targets: ['localhost:9090']
Save the file by pressing Ctrl+x, then y, and Enter.
Create a systemd service file for Prometheus:
sudo nano /etc/systemd/system/prometheus.service
Add the following content:
[Unit]
Description=Prometheus
Wants=network-online.target
After=network-online.target

[Service]
User=prome
Group=prome
Type=simple
ExecStart=/usr/local/bin/prometheus \
 --config.file /etc/prometheus/prometheus.yml \
 --storage.tsdb.path /var/lib/prometheus/ \
 --web.console.templates=/etc/prometheus/consoles \
 --web.console.libraries=/etc/prometheus/console_libraries

[Install]
WantedBy=multi-user.target
Save and close the file.
Reload systemd and start Prometheus:
sudo systemctl daemon-reload
sudo systemctl enable prometheus
sudo systemctl start prometheus
Check the service status:
sudo systemctl status prometheus
Your status view should be similar to the following:
prometheus.service - Prometheus
 Loaded: loaded (/etc/systemd/system/prometheus.service; disabled; vendor preset: enabled)
 Active: active (running) since [time]
... other stats ...
Testing Prometheus
Open port 9090 for web traffic:
sudo ufw allow 9090/tcp
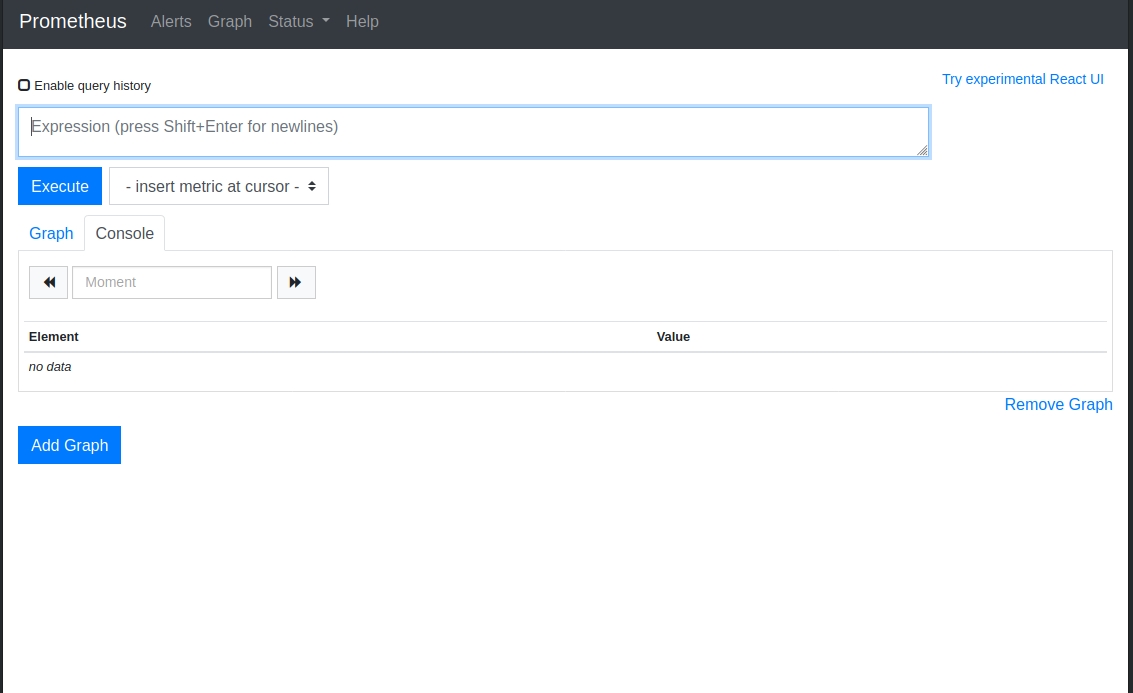
Access Prometheus by navigating in your web browser to:
http://[ip-address]:9090
Replace “[ip-address]” with your server’s IP. You can use “localhost” or “127.0.0.1” if accessing locally on the same machine.
Prometheus should display its web interface:

Conclusion
We hope this guide helps you successfully install Prometheus on your server. If you have further questions or want to explore more about Prometheus and system monitoring, feel free to leave a comment below!
Frequently Asked Questions
- What is Prometheus used for? Prometheus is used for monitoring system performance, collecting metrics, and alerting when certain thresholds are exceeded.
- Why do I need to create a separate user for Prometheus? Creating a separate user enhances security by limiting the permissions available to the Prometheus service.
- How can I access Prometheus remotely? Ensure port 9090 is open on your firewall, and use your server’s IP address followed by :9090 in a web browser.
- What happens if Prometheus isn’t running? Check the service status using
sudo systemctl status prometheus, and start it withsudo systemctl start prometheusif necessary.
