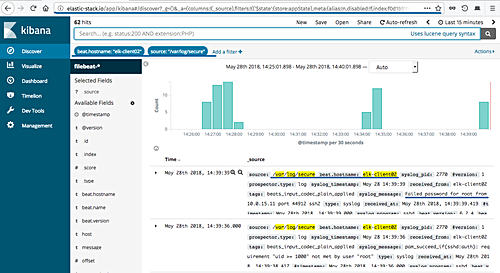
Elastic Stack, formerly ELK Stack, is a robust, open-source software collection developed by Elastic. It is designed to gather data from various sources, enabling you to collect, store, process, analyze, and visualize data in any format on a central platform.
The stack comprises several key components: Elasticsearch for data storage, Kibana for dashboard access and visualization, Logstash for data pipeline processing with plugins, and Beats for lightweight data shipping from edge machines.
Elastic Stack can be deployed on your server premises or accessed through the official Software as a Service (SaaS) on Elastic Cloud.
Installation Overview
This tutorial walks you through installing Elastic Stack on Ubuntu 20.04. We’ll install Elasticsearch and Kibana on a single server and set up Filebeat on another server to relay logs to the central Elasticsearch server.
System Requirements
For this guide, you’ll need two Ubuntu 20.04 servers. The Elastic Stack software will be installed on a server with at least 4 GB of RAM, while the other server, with a minimum of 1 GB of RAM, will serve as a Filebeat client.
What You’ll Accomplish:
- Add Elastic Stack Repository
- Install and Configure Elasticsearch
- Install and Configure Kibana
- Set Up Nginx as a Reverse Proxy for Kibana
- Install and Configure Filebeat
- Create a New Role for Kibana User
- Establish a New Index Pattern in Filebeat
Step 1: Add Elastic Stack Repository
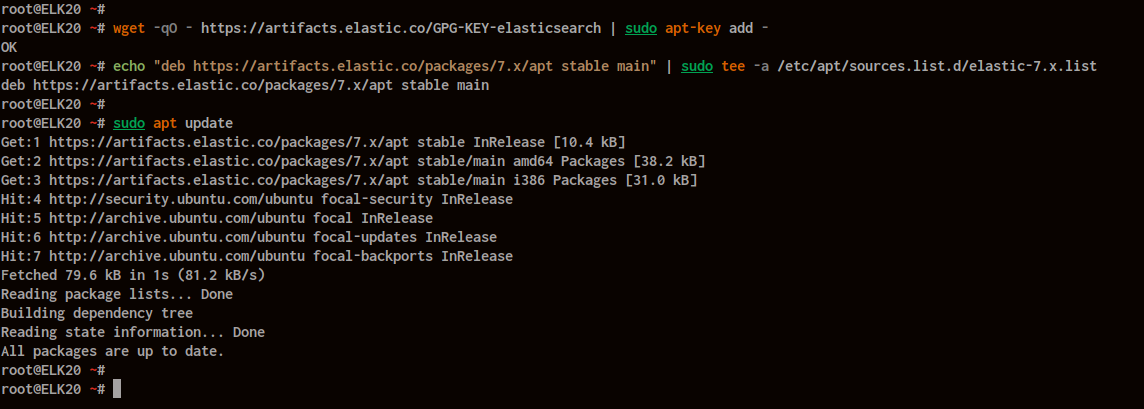
Begin by adding the Elastic Stack GPG key and repository to both servers.
Install the ‘apt-transport-https’ package for secure HTTPS-based installations:
sudo apt install apt-transport-https
Add the Elastic Stack GPG key and repository:
wget -qO - https://artifacts.elastic.co/GPG-KEY-elasticsearch | sudo apt-key add -
echo "deb https://artifacts.elastic.co/packages/7.x/apt stable main" | sudo tee -a /etc/apt/sources.list.d/elastic-7.x.list
Update your package list:
sudo apt update
The Elastic Stack software can now be installed on both servers.
Step 2: Install and Configure Elasticsearch
Install and configure Elasticsearch on the ‘ELK20’ server with IP ‘172.16.0.3’.
Edit the ‘/etc/hosts’ file:
vim /etc/hosts
Add your server hostname and internal IP:
172.16.0.3 ELK20
Install the Elasticsearch package:
sudo apt install elasticsearch
Edit ‘elasticsearch.yml’ in ‘/etc/elasticsearch’:
cd /etc/elasticsearch/
vim elasticsearch.yml
Configure the following settings:
node.name: ELK20
network.host: 172.16.0.3
http.port: 9200
cluster.initial_master_nodes: ["ELK20"]
xpack.security.enabled: true
Save and close the file.
Reload systemd and start Elasticsearch:
systemctl daemon-reload
systemctl start elasticsearch
systemctl enable elasticsearch
Elasticsearch is now running on your server.

Generate passwords for built-in users:
cd /usr/share/elasticsearch/
bin/elasticsearch-setup-passwords auto -u "http://172.16.0.3:9200"
Initiate password setup by confirming with 'y'.
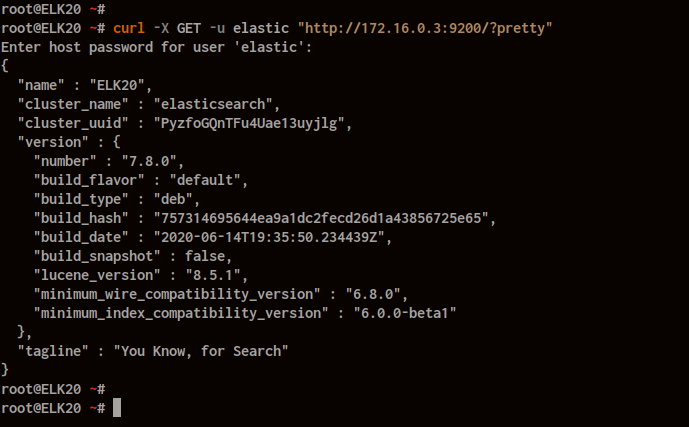
Test your Elasticsearch installation:
curl -X GET -u elastic "http://172.16.0.3:9200/?pretty"
Step 3: Install and Configure Kibana
Install Kibana on the same server as Elasticsearch:
sudo apt install kibana
Edit ‘kibana.yml’ in ‘/etc/kibana’:
cd /etc/kibana/
vim kibana.yml
Configure the server options:
server.port: 5601
server.host: "172.16.0.3"
server.name: "ELK20"
Update Elasticsearch URL and credentials:
elasticsearch.url: "http://172.16.0.3:9200"
elasticsearch.username: "kibana_system"
elasticsearch.password: "your_generated_password"
Save and close the configuration file.
Reload systemd, start Kibana, and enable on boot:
systemctl daemon-reload
systemctl start kibana
systemctl enable kibana

Create a new Kibana user:
curl -X POST -u elastic "http://172.16.0.3:9200/_security/user/hakase?pretty" -H 'Content-Type: application/json' -d'
{
  "password" : "hakasepasskibana",
  "roles" : [ "kibana_admin" ]
}'

Step 4: Set Up Nginx as a Reverse Proxy for Kibana
Install Nginx:
sudo apt install nginx -y
Create a new Nginx virtual host file for Kibana:
cd /etc/nginx/sites-available/
vim kibana
Configure Nginx with your domain and IP:
server {
  listen 80;
  server_name elk.hakase-labs.io;
  location / {
    proxy_pass http://172.16.0.3:5601;
    proxy_http_version 1.1;
    proxy_set_header Upgrade $http_upgrade;
    proxy_set_header Connection 'upgrade';
    proxy_set_header Host $host;
    proxy_cache_bypass $http_upgrade;
  }
}
Enable the virtual host and restart Nginx:
ln -s /etc/nginx/sites-available/kibana /etc/nginx/sites-enabled/
nginx -t
systemctl restart nginx
Access Kibana via http://elk.hakase-labs.io/.

Step 5: Install and Configure Filebeat
Install Filebeat on your client machine:
sudo apt install filebeat
Edit ‘filebeat.yml’ in ‘/etc/filebeat’:
cd /etc/filebeat/
vim filebeat.yml
Enable the input configuration:
filebeat.inputs:
- type: log
  enabled: true
  paths:
    - /var/log/*.log
Configure Kibana and Elasticsearch details:
setup.kibana:
  host: "172.16.0.3:5601"
  username: "kibana"
  password: "your_generated_password"
output.elasticsearch:
hosts: [“172.16.0.3:9200”]
username: “elastic”
password: “your_generated_password”
Reload systemd, start Filebeat, and enable on boot:
systemctl daemon-reload
systemctl start filebeat
systemctl enable filebeat

Load the Filebeat index template to Elasticsearch:
filebeat setup --index-management -E output.logstash.enabled=false -E 'output.elasticsearch.hosts=["http://172.16.0.3:9200"]'
Step 6: Setup New Role for Kibana User
Create a new Elasticsearch role for user access management:
curl -XPOST -u elastic 'http://172.16.0.3:9200/_security/role/events_index' -H "Content-Type: application/json" -d '{
  "indices" : [
    {
      "names" : [ "*" ],
      "privileges" : [ "all" ]
    }
  ]
}'

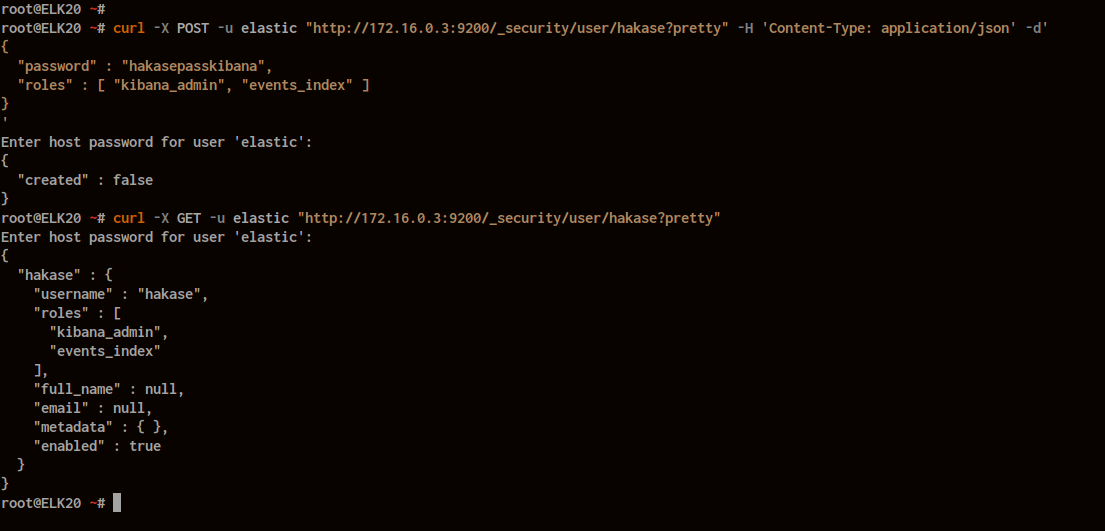
Assign the new role to your user:
curl -X POST -u elastic "http://172.16.0.3:9200/_security/user/hakase?pretty" -H 'Content-Type: application/json' -d'
{
  "password" : "hakasepasskibana",
  "roles" : [ "kibana_admin", "events_index" ]
}'
Step 7: Create New Index Pattern for Filebeat
Create Index Pattern
In the Kibana Dashboard, navigate to the “Management” section and open “Stack Management”.
Under “Kibana”, select “Index Patterns”.
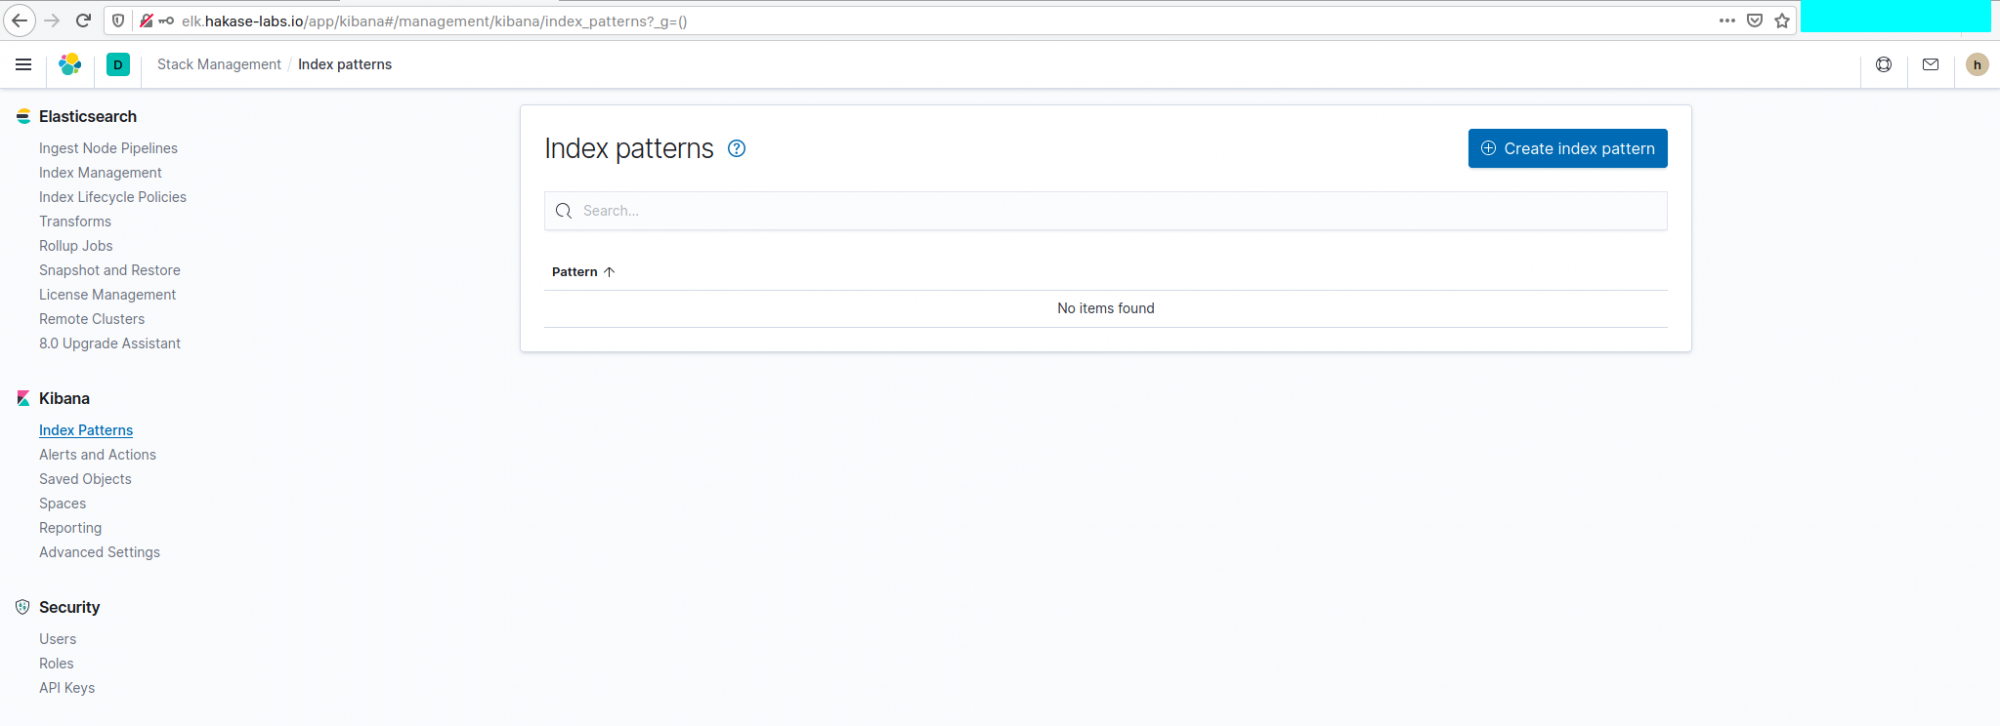
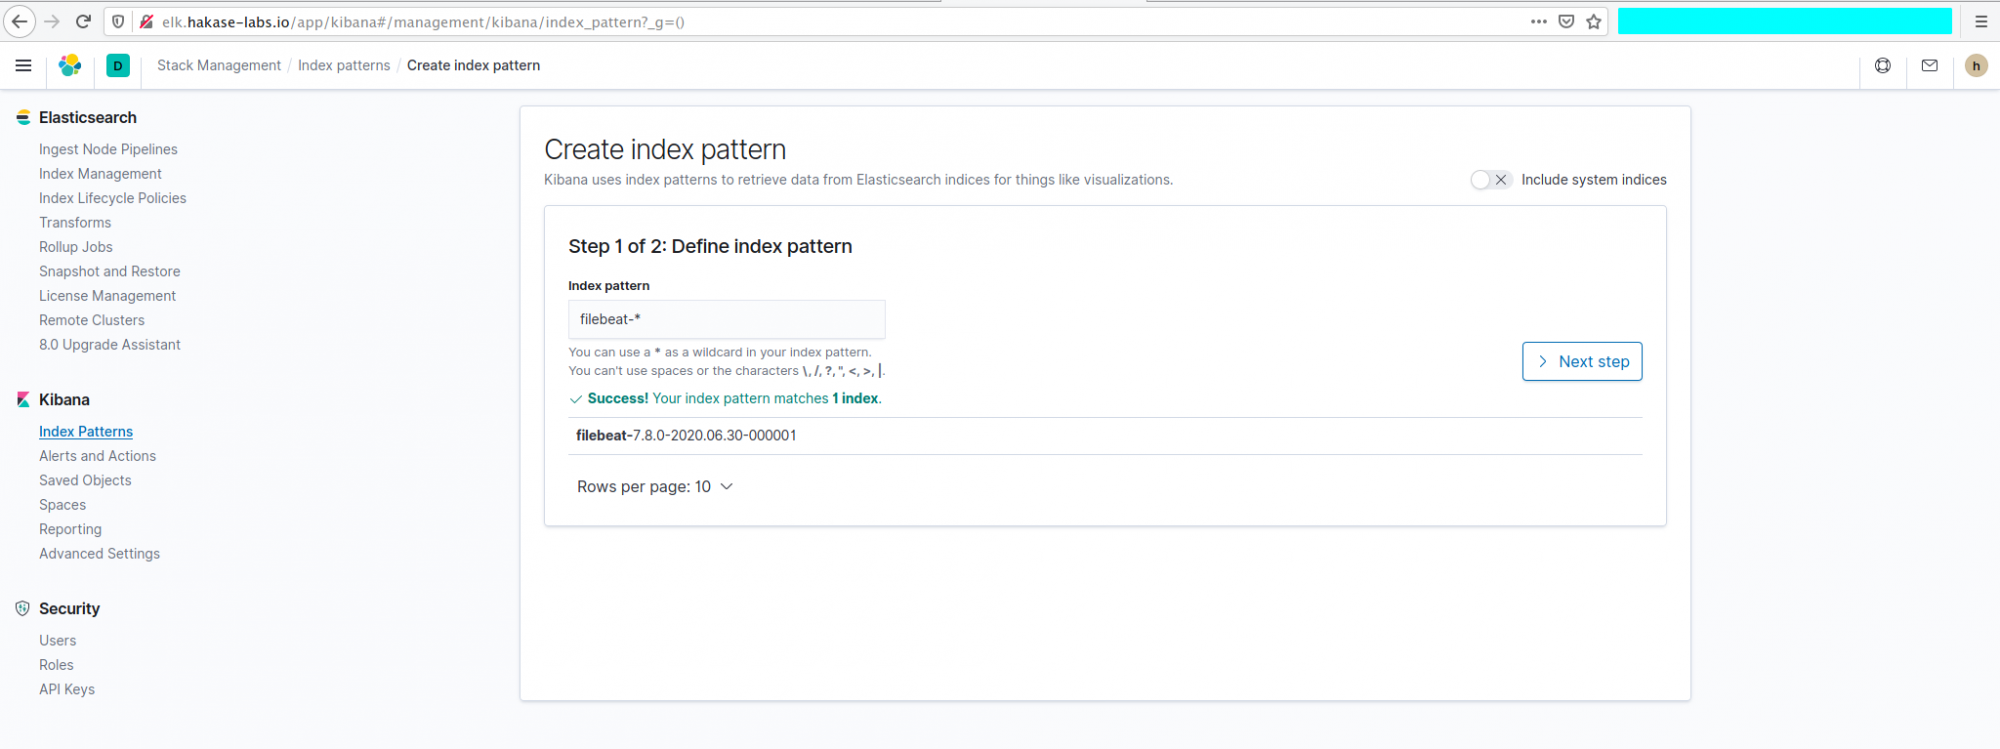
Create a new index pattern:
filebeat-*
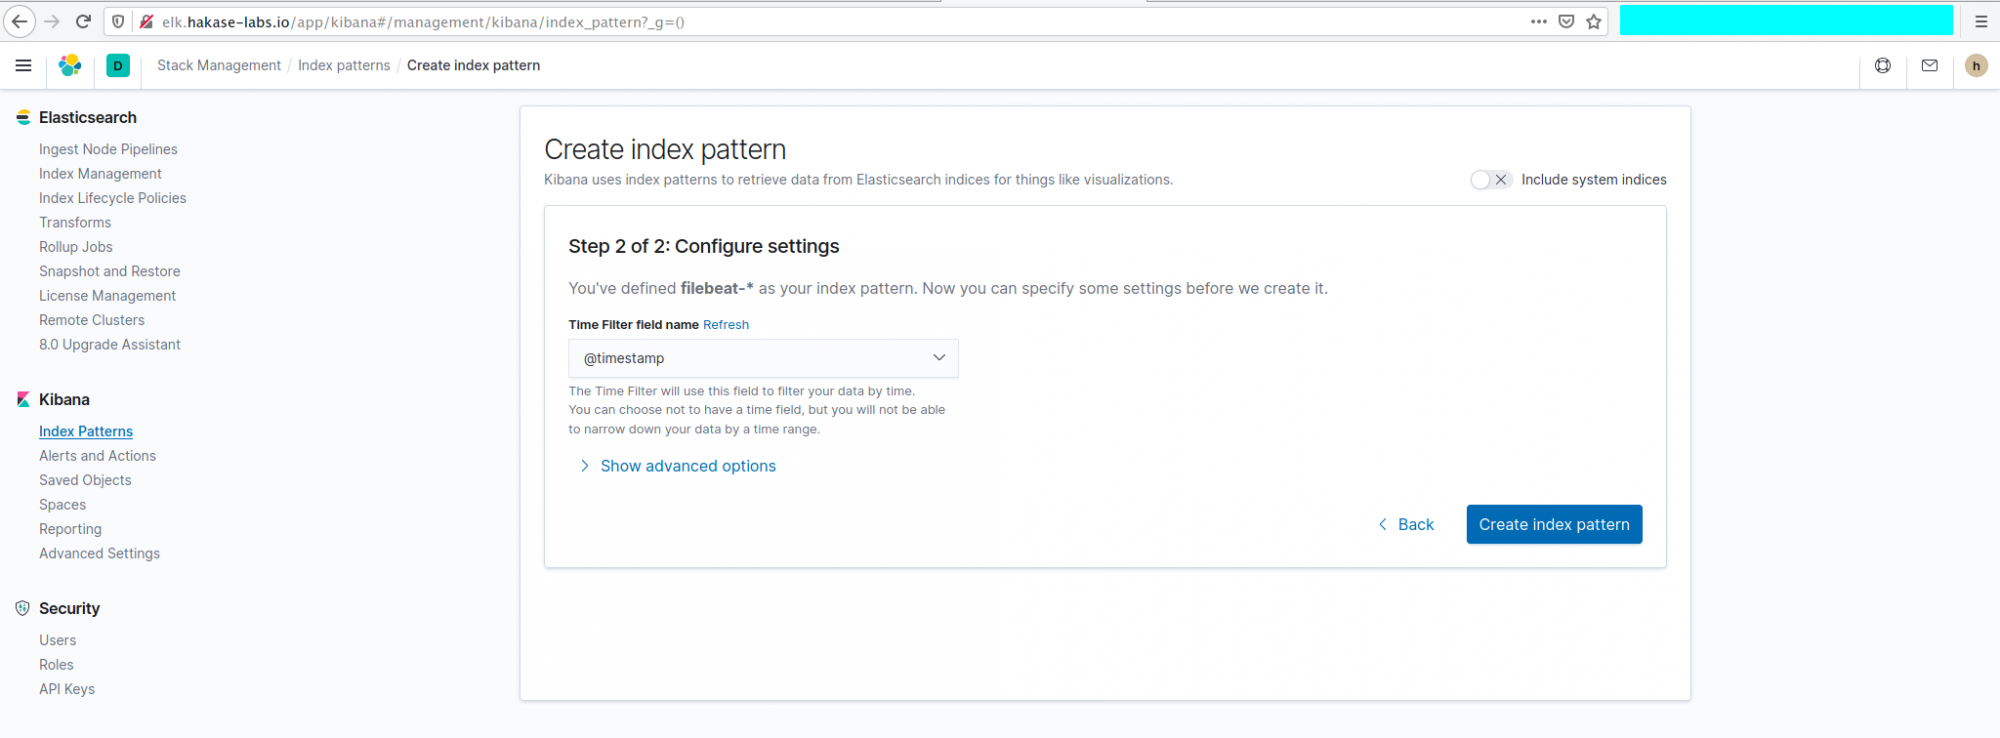
Choose “@timestamp” for Time Filter field name and click “Create index pattern“.
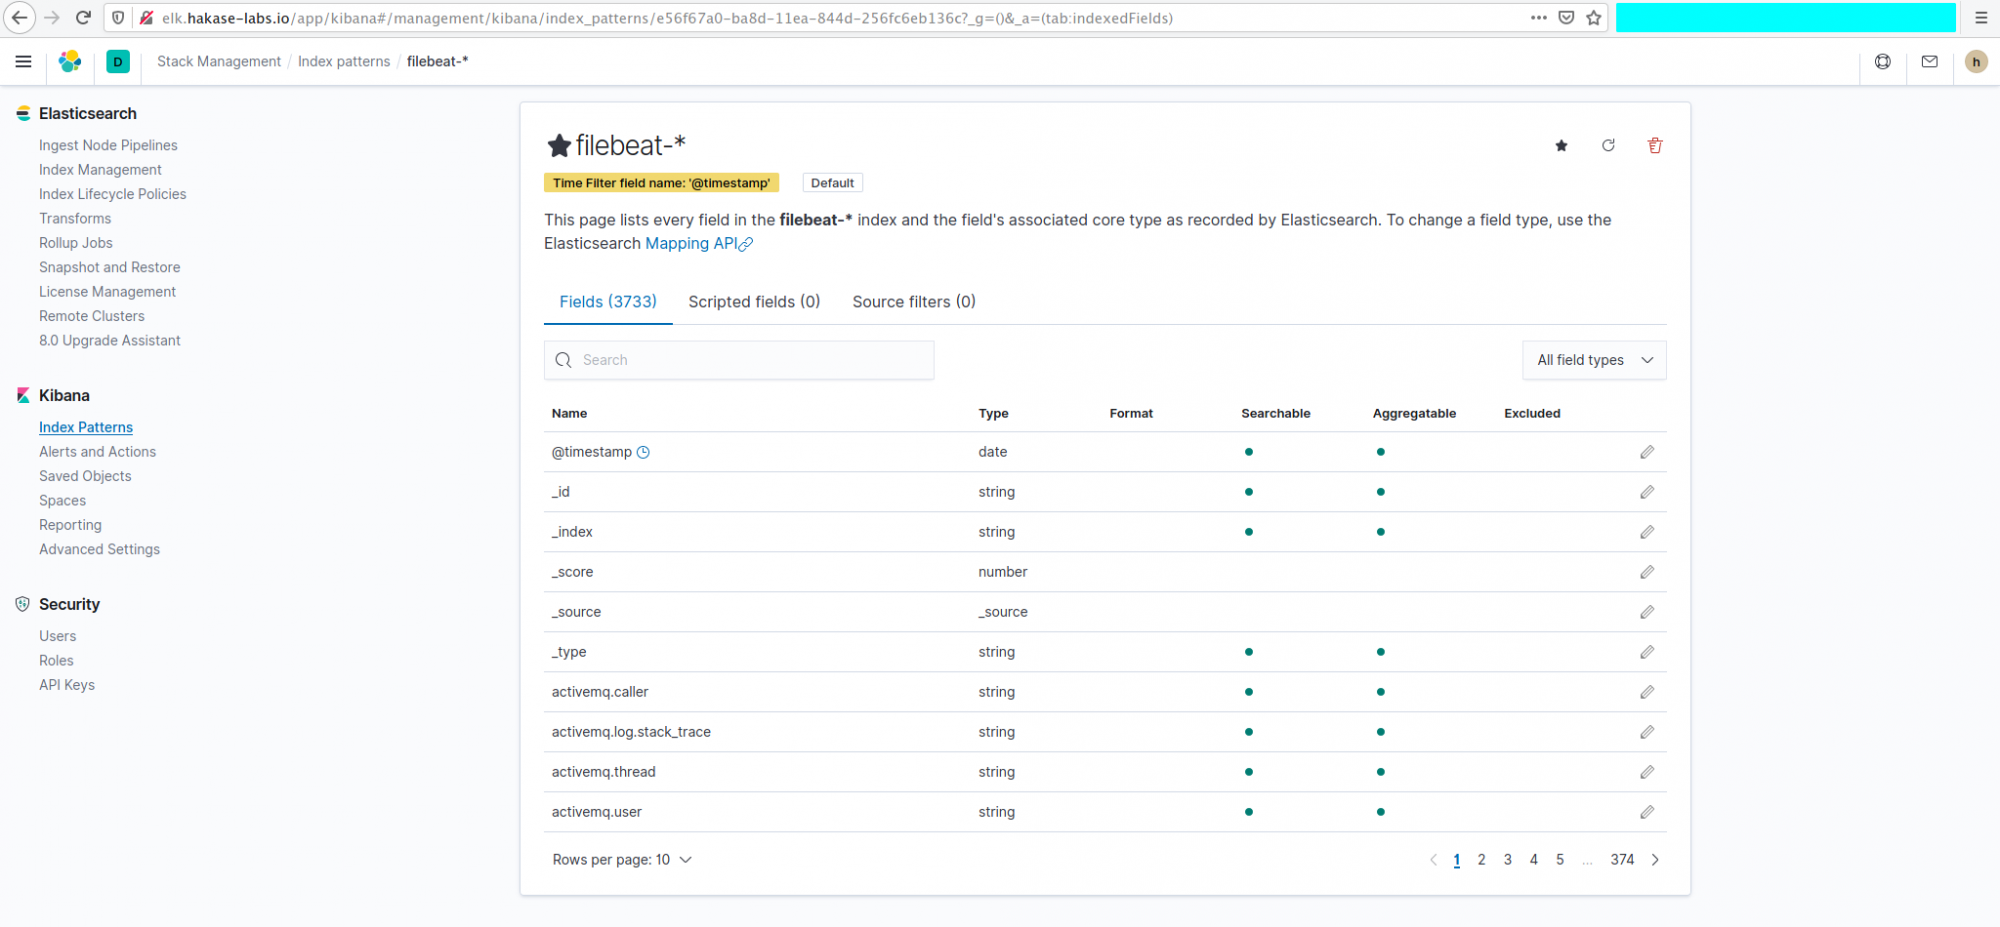
The ‘filebeat-*‘ index pattern is now created and set as default.
Show Data on Kibana
To explore data, open “Discover” from the Kibana menu.
Apply a filter using Kibana Query Language (KQL):
host.name : client01 and log.file.path: "/var/log/auth.log"
Get detailed authentication logs from the client machine.
Conclusion
Successfully complete the installation of Elastic Stack with security features on Ubuntu 20.04. You’re now equipped to manage and explore data efficiently.
FAQ
- What is Elastic Stack used for?
- Elastic Stack is used for collecting, storing, processing, analyzing, and visualizing data from various sources in diverse formats, primarily for log and event data analytics.
- What are the components of Elastic Stack?
- Elastic Stack consists of Elasticsearch for data indexing and search, Kibana for visualization, Logstash for data processing, and Beats for lightweight data shipping.
- Can Elastic Stack be deployed in the cloud?
- Yes, Elastic offers a SaaS version known as Elastic Cloud, allowing for easy deployment without the need for managing infrastructure.
- How secure is Elastic Stack?
- Elastic Stack includes security features such as secure communications, authentication, and authorization to help protect your data.
- Why use Nginx with Kibana?
- Nginx can be deployed as a reverse proxy in front of Kibana to enhance security, support SSL, and manage high-traffic load efficiently.
