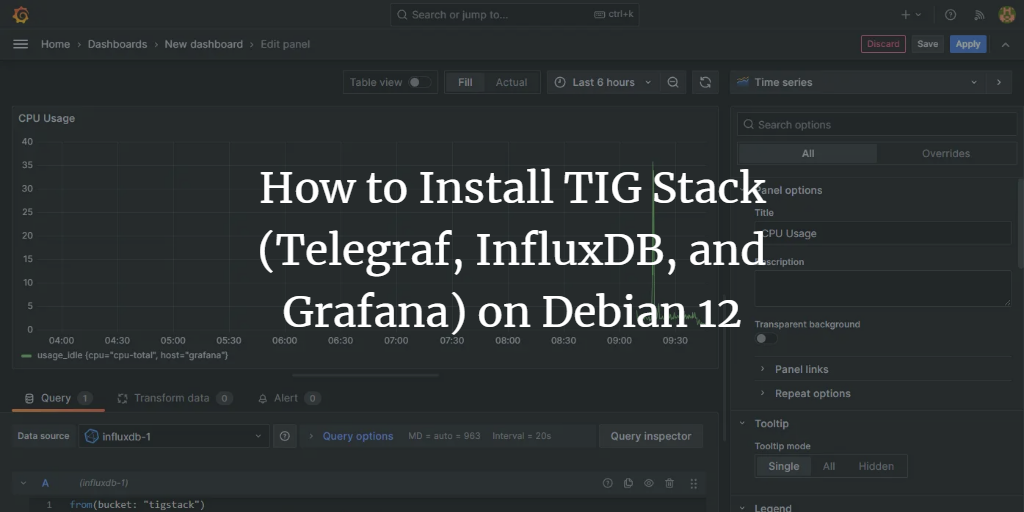
The TIG Stack—composed of Telegraf, InfluxDB, and Grafana—is a suite of open-source tools that simplifies the collection, storage, visualization, and alerting of system metrics. With these tools, you can monitor and visualize metrics such as memory usage, disk space, logged-in users, system load, swap usage, uptime, and running processes from a centralized platform.
- Telegraf – An open-source metrics collection agent for gathering data and events from various sources such as databases, systems, and IoT sensors. It supports numerous output plugins, including InfluxDB, Graphite, and Kafka, for data transmission.
- InfluxDB – A high-performance time-series database written in Go, optimized for fast, reliable storage of time-stamped data. It’s ideal for managing metrics, events, and real-time analytics.
- Grafana – A data visualization platform that integrates with multiple input plugins, including Graphite and Elasticsearch. It provides a comprehensive dashboard for monitoring system metrics and performance data.
This guide will walk you through the installation and configuration of the TIG Stack on a Debian 12 server.
Prerequisites
- A Debian 12 server with at least 1 GB of RAM.
- A non-sudo user with root privileges.
- The UFW firewall enabled and running.
- A Fully Qualified Domain Name (FQDN) like
grafana.example.compointing to your server. - An SMTP account for email notifications via services like Amazon SES or Mailgun.
- Ensure that your system is up to date:
$ sudo apt update && sudo apt upgrade
- Install essential packages for the tutorial and Craft CMS:
$ sudo apt install curl wget nano software-properties-common dirmngr apt-transport-https ca-certificates lsb-release debian-archive-keyring gnupg2 ufw unzip -y
Step 1 – Configure Firewall
Before installation, configure the firewall to open the necessary ports for InfluxDB and Grafana.
Check the firewall status:
$ sudo ufw status
Example output:
Status: active

To                         Action      From
--                         ------      ----
OpenSSH                    ALLOW       Anywhere
OpenSSH (v6)               ALLOW       Anywhere (v6)
Open ports 8086 for InfluxDB and 3000 for Grafana:
$ sudo ufw allow 8086
$ sudo ufw allow 3000
Allow HTTP and HTTPS traffic:
$ sudo ufw allow http
$ sudo ufw allow https
Confirm the firewall status:
$ sudo ufw status
Status: active

To                         Action      From
--                         ------      ----
OpenSSH                    ALLOW       Anywhere
8086                       ALLOW       Anywhere
3000                       ALLOW       Anywhere
80/tcp                     ALLOW       Anywhere
443                        ALLOW       Anywhere
OpenSSH (v6)               ALLOW       Anywhere (v6)
8086 (v6)                  ALLOW       Anywhere (v6)
3000 (v6)                  ALLOW       Anywhere (v6)
80/tcp (v6)                ALLOW       Anywhere (v6)
443 (v6)                   ALLOW       Anywhere (v6)
Step 2 – Install InfluxDB
Use InfluxDB’s official repository to facilitate installation.
Download the InfluxDB GPG key:
$ wget -q https://repos.influxdata.com/influxdata-archive_compat.key
Import the GPG key:
$ echo '393e8779c89ac8d958f81f942f9ad7fb82a25e133faddaf92e15b16e6ac9ce4c influxdata-archive_compat.key' | sha256sum -c && cat influxdata-archive_compat.key | gpg --dearmor | sudo tee /etc/apt/trusted.gpg.d/influxdata-archive_compat.gpg > /dev/null
influxdata-archive_compat.key: OK
Import the InfluxDB repository:
$ echo 'deb [signed-by=/etc/apt/trusted.gpg.d/influxdata-archive_compat.gpg] https://repos.influxdata.com/debian stable main' | sudo tee /etc/apt/sources.list.d/influxdata.list
Update the repository list:
$ sudo apt update
Install InfluxDB (opt for the latest version available):
$ sudo apt install influxdb2
Start the InfluxDB service:
$ sudo systemctl start influxdb
Check the service status:
$ sudo systemctl status influxdb
? influxdb.service - InfluxDB is an open-source, distributed, time series database
     Loaded: loaded (/lib/systemd/system/influxdb.service; enabled; preset: enabled)
     Active: active (running) since Tue 2024-01-02 02:39:41 UTC; 1s ago
       Docs: https://docs.influxdata.com/influxdb/
    Process: 5584 ExecStart=/usr/lib/influxdb/scripts/influxd-systemd-start.sh (code=exited, status=0/SUCCESS)
   Main PID: 5585 (influxd)
      Tasks: 8 (limit: 2299)
     Memory: 53.1M
        CPU: 735ms
     CGroup: /system.slice/influxdb.service
             ??5585 /usr/bin/influxd
........
Step 3 – Create InfluxDB Database and User Credentials
Establish a database and user credentials to record data from Telegraf.
InfluxDB includes a command-line tool named influx for interacting with the server. Use the following command for initial setup:
$ influx setup
> Welcome to InfluxDB 2.0!
? Please type your primary username navjot
? Please type your password ***************
? Please type your password again ***************
? Please type your primary organization name howtoforge
? Please type your primary bucket name tigstack
? Please type your retention period in hours, or 0 for infinite 360
? Setup with these parameters?
  Username:          navjot
  Organization:      howtoforge
  Bucket:            tigstack
  Retention Period:  360h0m0s
 Yes
User    Organization    Bucket
navjot  howtoforge      tigstack
Your details are stored within /home/username/.influxdbv2/configs. Alternately, you can execute setup via the URL http://<serverIP>:8086/ within a browser.
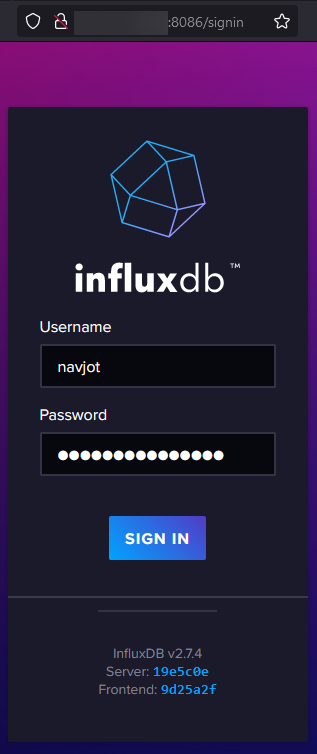
Post-setup, you’ll be greeted with this dashboard:
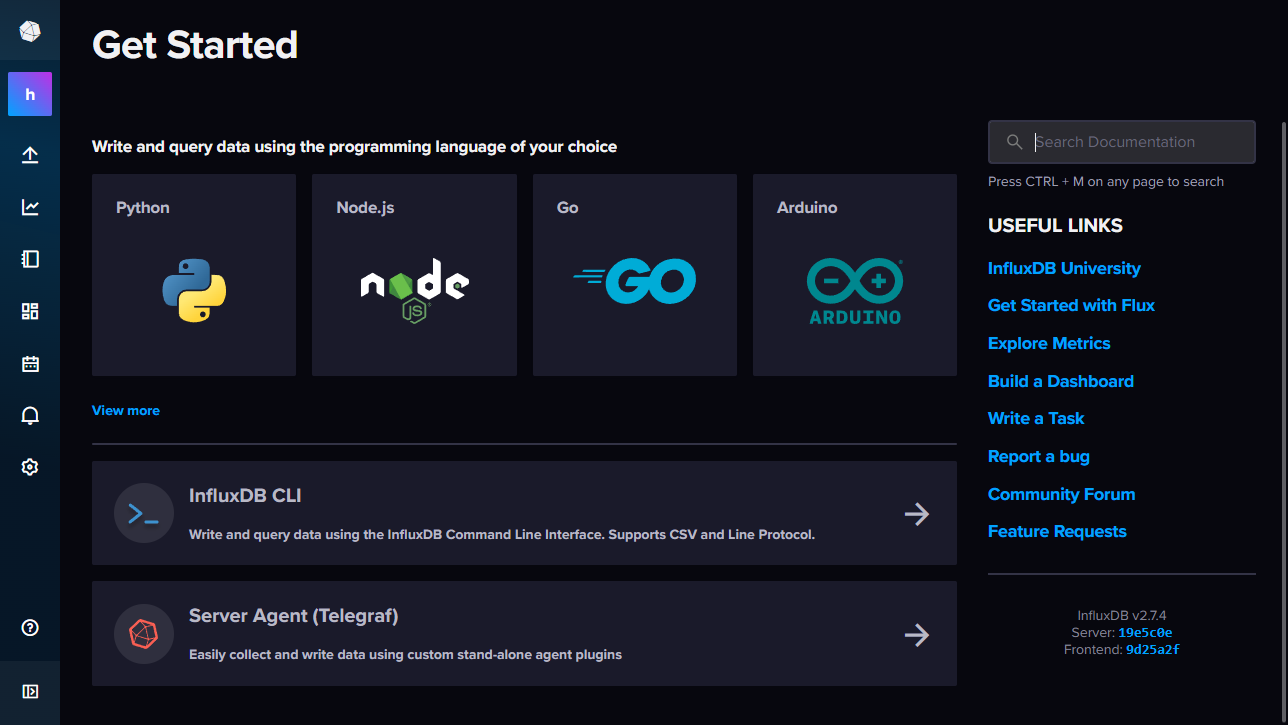
Create a new security token for specific organization and bucket access:

Navigate to the API Tokens page—here, you’ll find the default token:
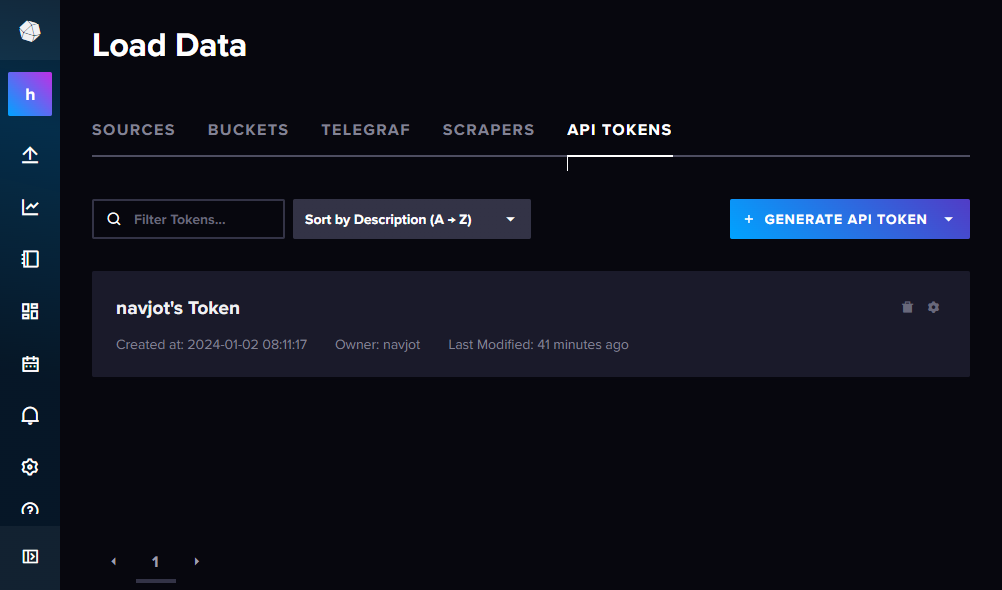
Click the Generate API Token button, choose Custom API Token, assign it a name (e.g., telegraf), and select default bucket permissions:
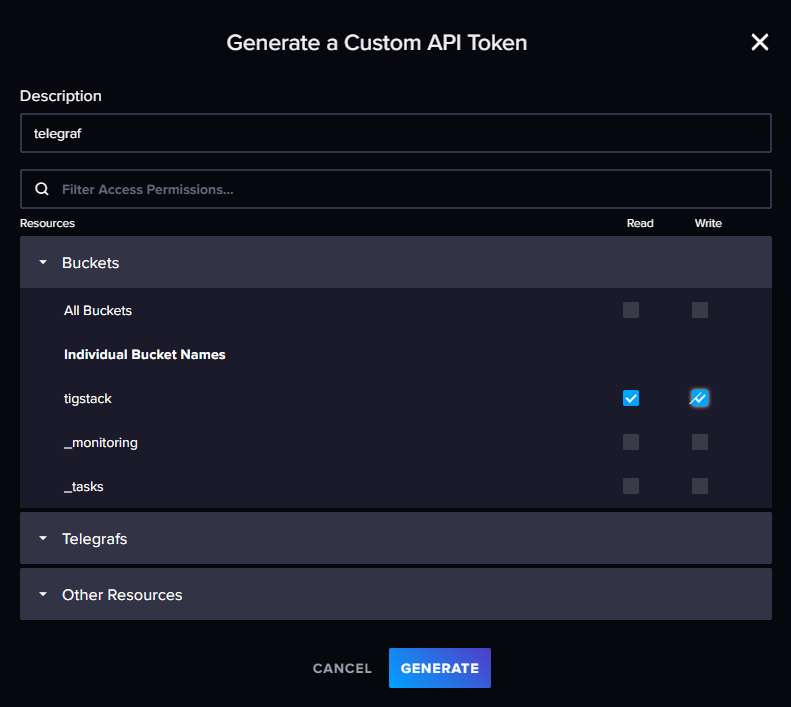
After generating the token, copy it for later reference:

Step 4 – Install Telegraf
Given that both Telegraf and InfluxDB utilize the same repository, install Telegraf directly:
$ sudo apt install telegraf
The service starts and enables automatically. Telegraf supports four plugin types:
- Input plugins – Collect metrics.
- Processor plugins – Transform, decorate, and filter metrics.
- Aggregator plugins – Create and aggregate metrics.
- Output plugins – Define destinations for metrics, including InfluxDB.
Modify the Telegraf configuration to connect with InfluxDB using /etc/telegraf/telegraf.conf:
$ sudo nano /etc/telegraf/telegraf.conf
Uncomment and edit the following section:
# # Configuration for sending metrics to InfluxDB 2.0
 [[outputs.influxdb_v2]]
    urls = ["http://127.0.0.1:8086"]
   token = "$INFLUX_TOKEN"
   organization = "howtoforge"
   bucket = "tigstack"
Replace $INFLUX_TOKEN with the saved token. Default input plugins are as follows:
# Read metrics about cpu usage
[[inputs.cpu]]
  percpu = true
  totalcpu = true
  collect_cpu_time = false
  report_active = false
  core_tags = false
# Read metrics about disk usage by mount point
[[inputs.disk]]
  ignore_fs = ["tmpfs", "devtmpfs", "devfs", "iso9660", "overlay", "aufs", "squashfs"]
# Read metrics about disk IO by device
[[inputs.diskio]]
....
....
# Get kernel statistics from /proc/stat
[[inputs.kernel]]
  # no configuration
# Read metrics about memory usage
[[inputs.mem]]
  # no configuration
# Get the number of processes and group them by status
[[inputs.processes]]
  # no configuration
# Read metrics about swap memory usage
[[inputs.swap]]
  # no configuration
# Read metrics about system load & uptime
[[inputs.system]]
  # no configuration
Save your changes and restart the Telegraf service:
$ sudo systemctl restart telegraf
Step 5 – Verify if Telegraf Stats are Stored in InfluxDB
Open the InfluxDB UI to verify if Telegraf stats are effectively recorded in InfluxDB:
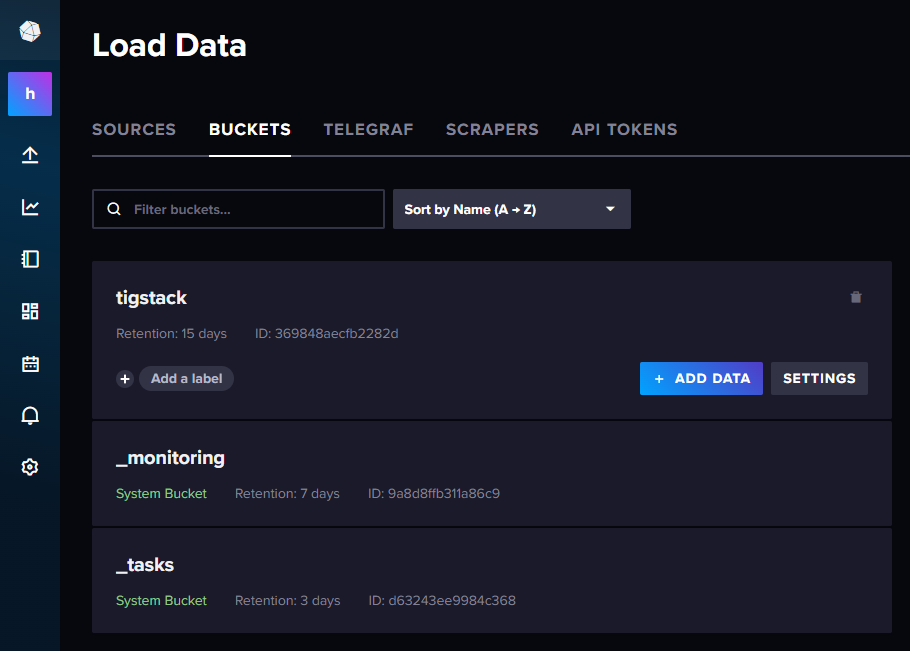
Access the Buckets menu by clicking the second icon on the InfluxDB UI’s sidebar and selecting tigstack bucket:
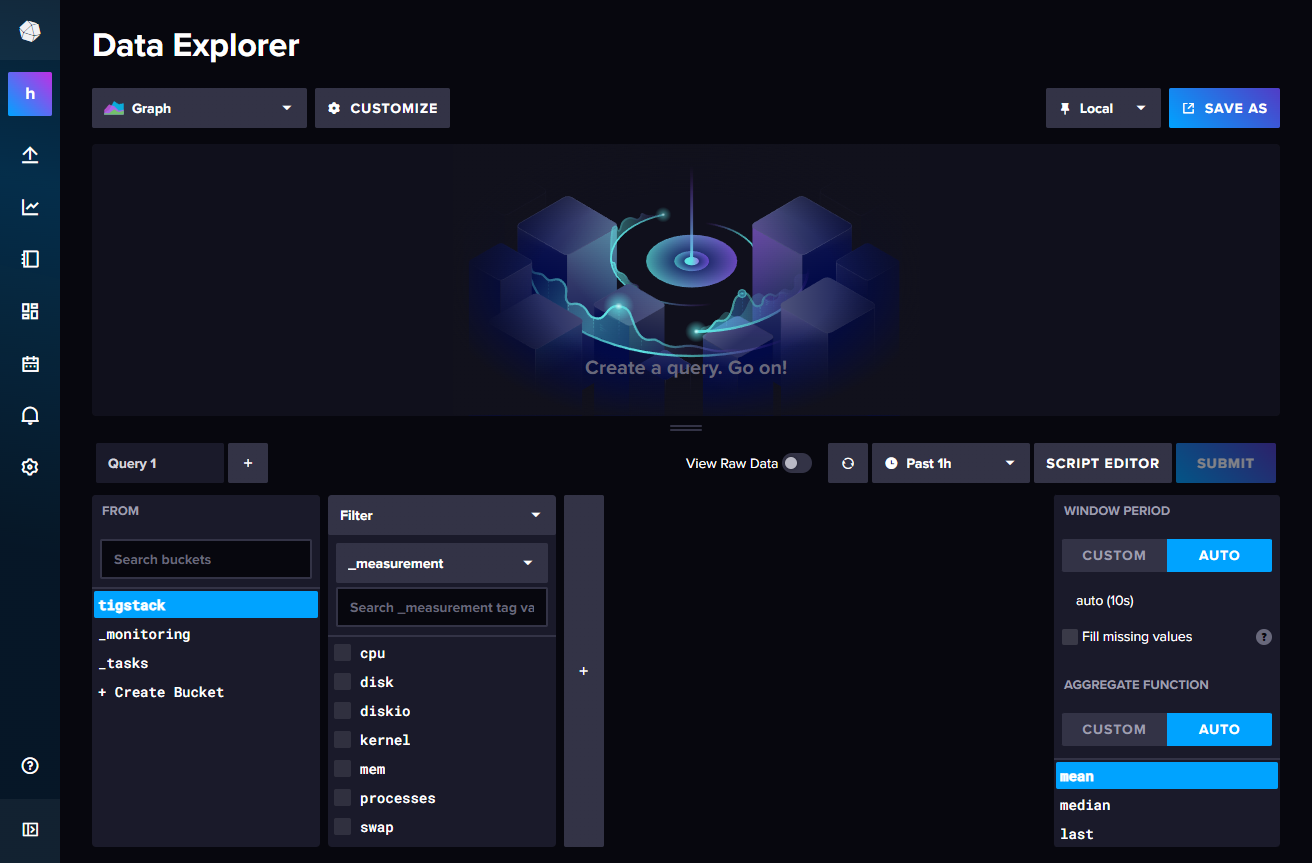
Explore the data:
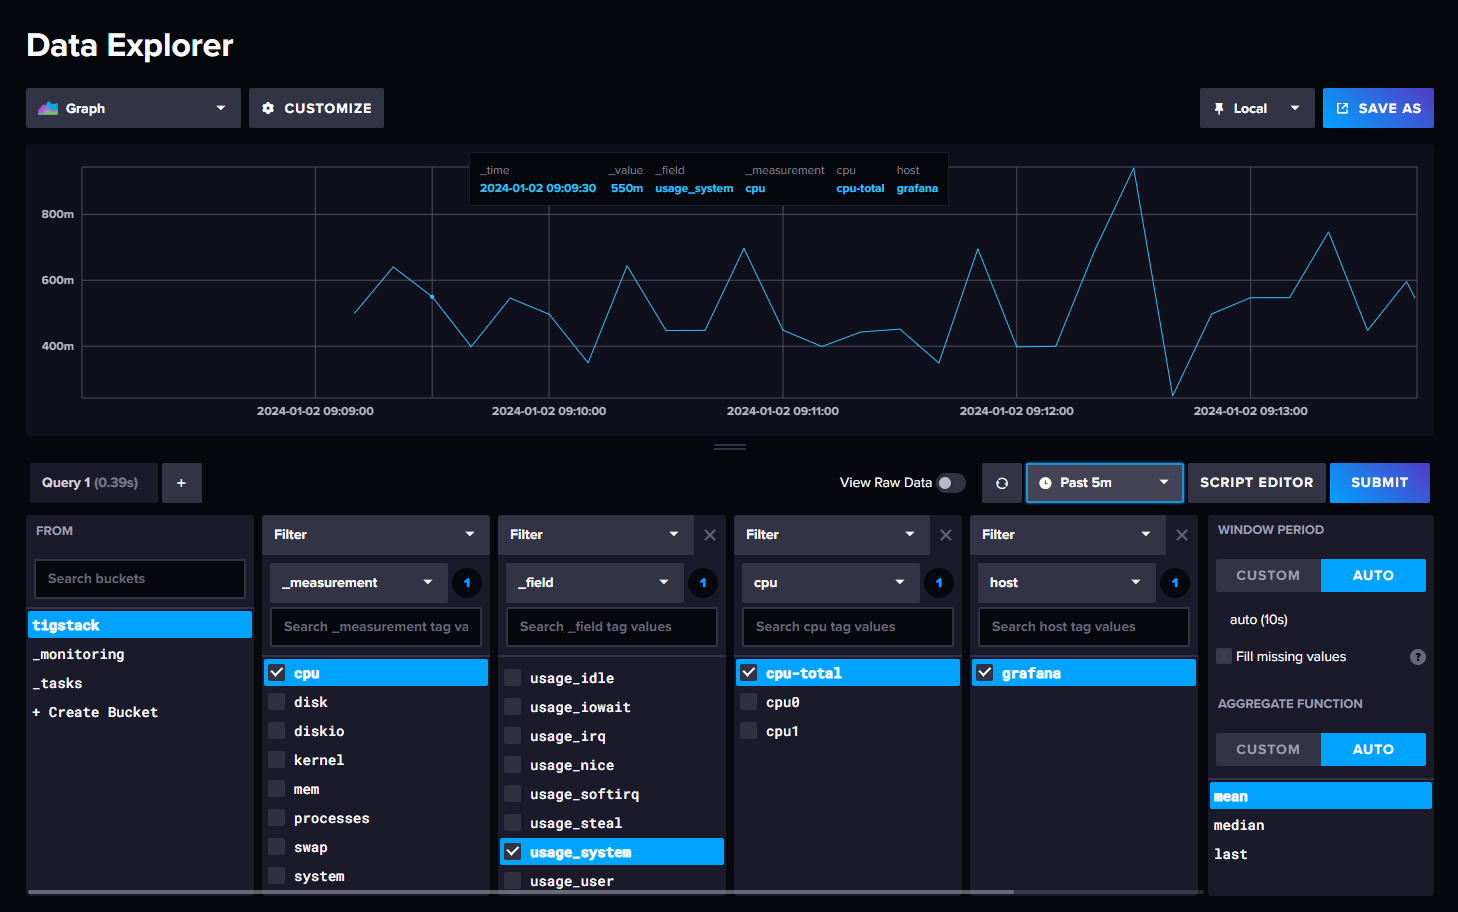
Confirm that data is being collected correctly:
Step 6 – Install Grafana
To install Grafana from its official repository, follow these steps:
Import the Grafana GPG key:
$ sudo mkdir -p /etc/apt/keyrings/
$ wget -q -O - https://apt.grafana.com/gpg.key | gpg --dearmor | sudo tee /etc/apt/keyrings/grafana.gpg > /dev/null
Add the repository to your system:
$ echo "deb [signed-by=/etc/apt/keyrings/grafana.gpg] https://apt.grafana.com stable main" | sudo tee -a /etc/apt/sources.list.d/grafana.list
Optionally, add the beta repository instead:
$ echo "deb [signed-by=/etc/apt/keyrings/grafana.gpg] https://apt.grafana.com beta main" | sudo tee -a /etc/apt/sources.list.d/grafana.list
Update the repository list:
$ sudo apt update
Install Grafana:
$ sudo apt install grafana
Start and enable Grafana:
$ sudo systemctl enable grafana-server --now
Check the service status:
$ sudo systemctl status grafana-server
? grafana-server.service - Grafana instance
     Loaded: loaded (/lib/systemd/system/grafana-server.service; enabled; preset: enabled)
     Active: active (running) since Tue 2024-01-02 03:48:01 UTC; 3s ago
       Docs: http://docs.grafana.org
   Main PID: 8769 (grafana)
      Tasks: 7 (limit: 2299)
     Memory: 42.6M
        CPU: 1.804s
     CGroup: /system.slice/grafana-server.service
             ??8769 /usr/share/grafana/bin/grafana server --config=/etc/grafana/grafana.ini --pidfile=/run/grafana/grafana-server.pid --packaging=deb cfg:default.paths.logs=/var/log/grafana cfg:default.paths...
.......
Step 7 – Set Up Grafana Data Source
To add InfluxDB as a data source, access http://<serverIP>:3000 in your browser:
Log in using the default credentials (admin/admin) and update your password:

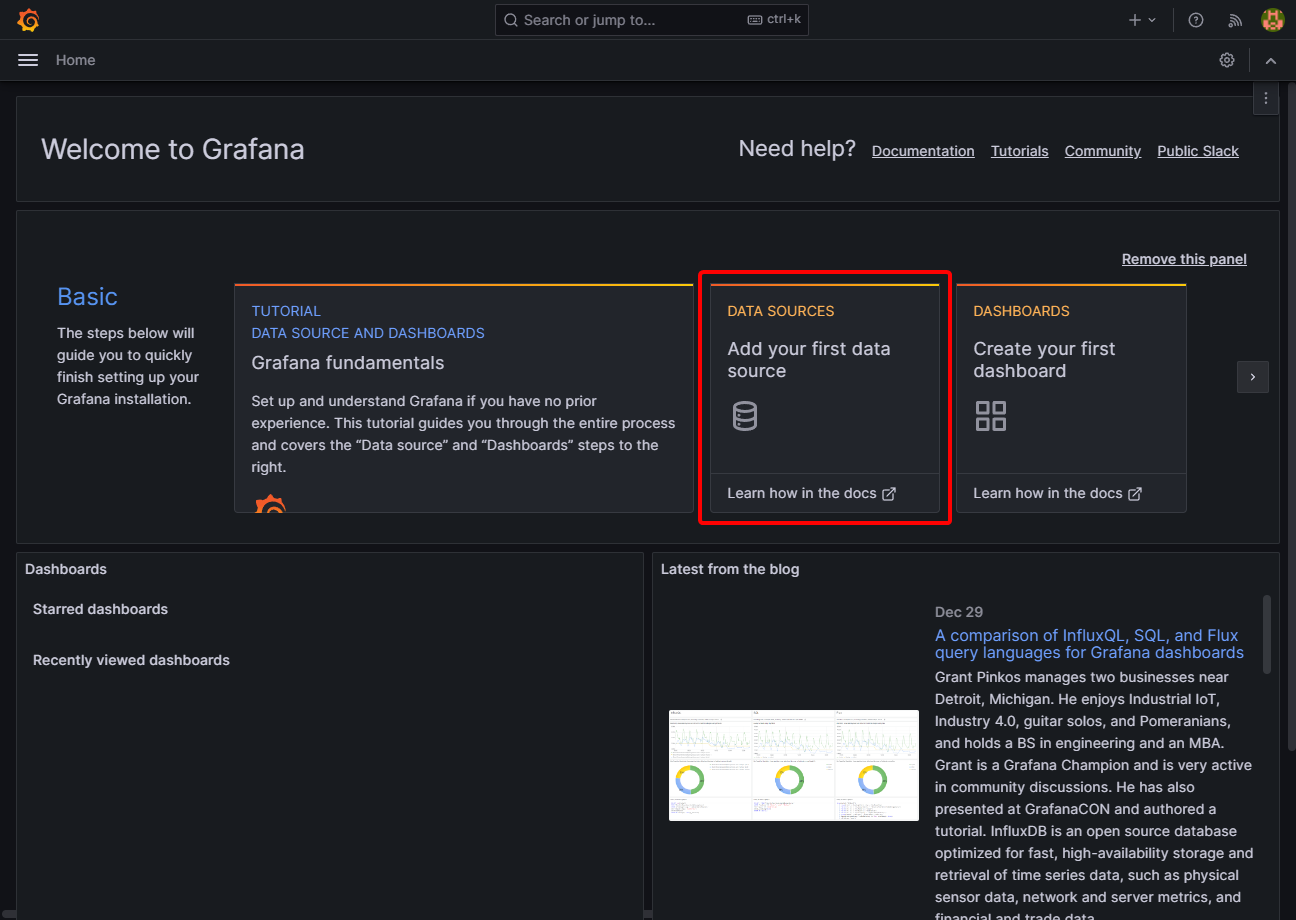
On the homepage, click Add your first data source:
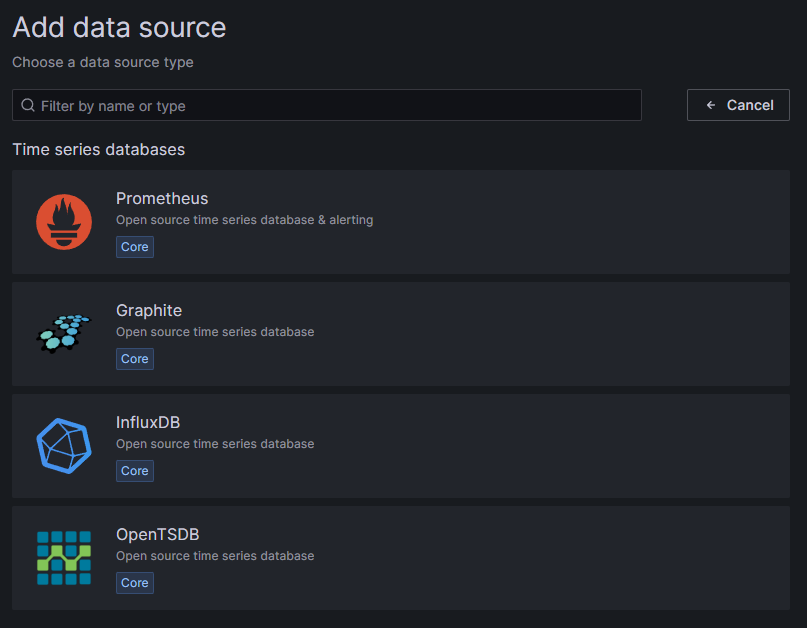
Select InfluxDB as the data source:
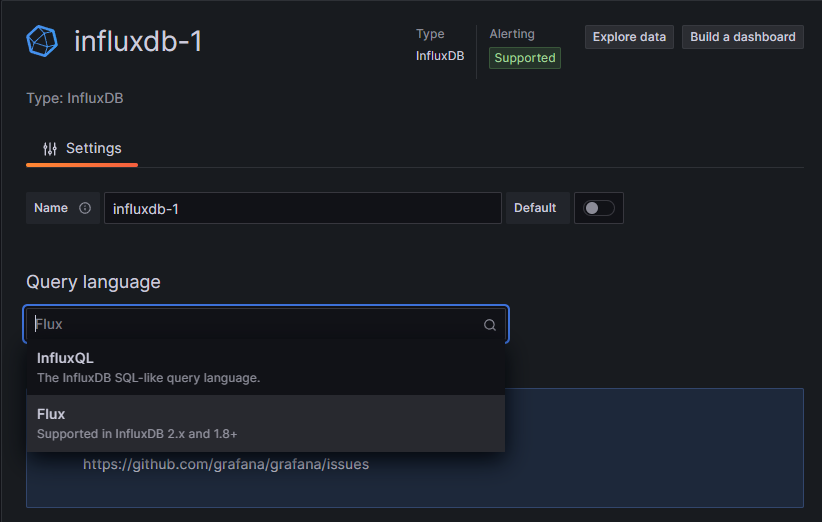
Select Flux as the query language for InfluxDB v2.x compatibility:
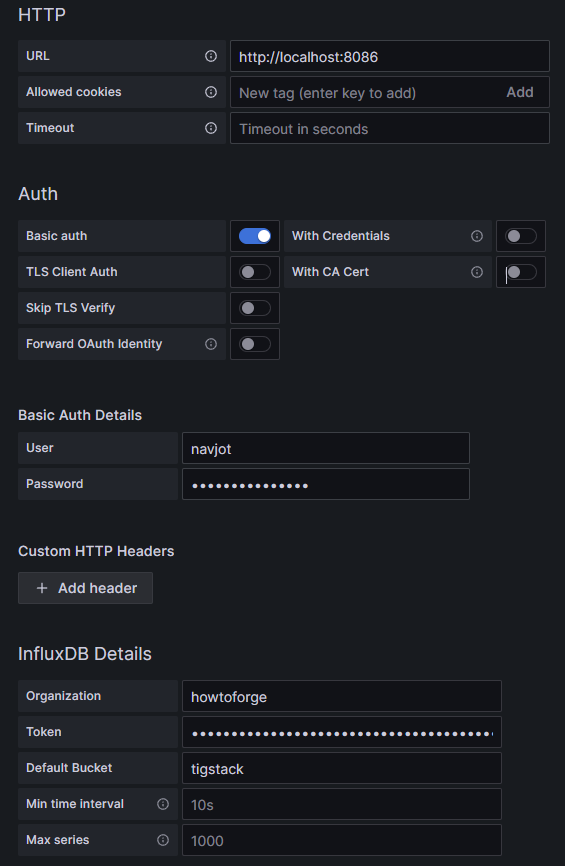
Enter the following details:
- URL:
http://localhost:8086 - User: navjot
- Password:
<yourinfluxdbpassword> - Organization: howtoforge
- Token:
<influxdbtoken> - Default Bucket: tigstack
Upon saving, ensure the setup is successful:

Step 8 – Set Up Grafana Dashboards
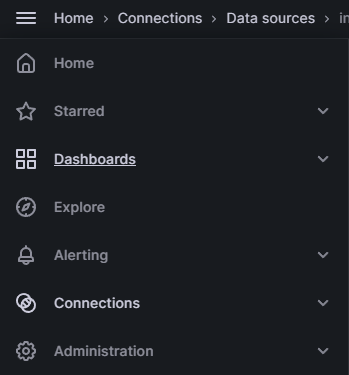
To create a new dashboard, access the Dashboards menu and click Create Dashboard:
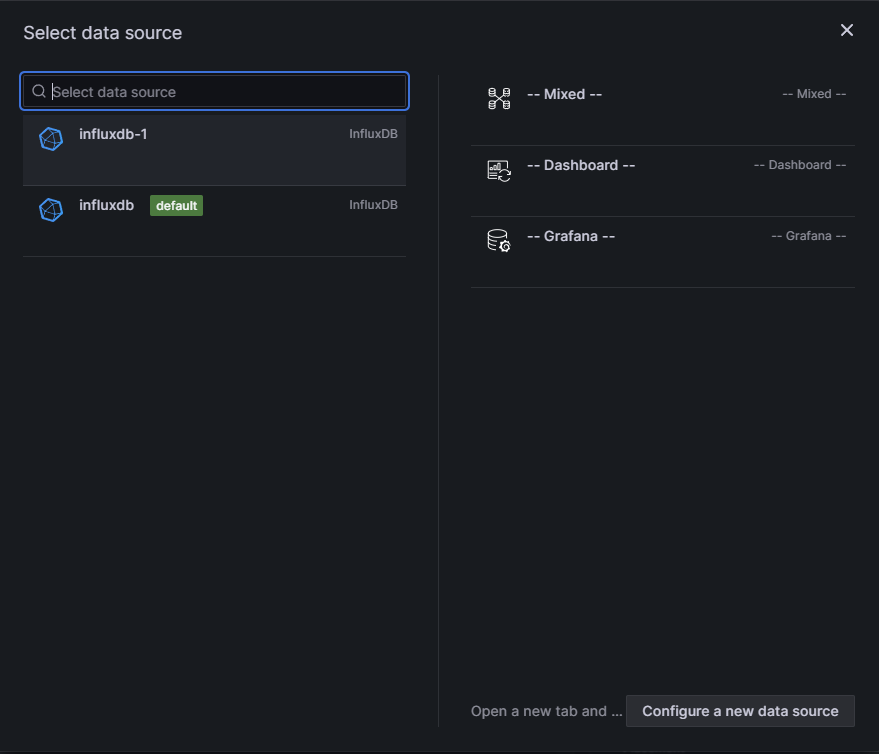
Add and configure visualizations. Select influxdb-1 as the data source:
Paste the following Flux code in the Query Editor for CPU Usage:
from(bucket: "NAMEOFYOUBUCKET")
  |> range(start: v.timeRangeStart, stop: v.timeRangeStop)
  |> filter(fn: (r) => r["_measurement"] == "cpu")
  |> filter(fn: (r) => r["_field"] == "usage_idle")
  |> filter(fn: (r) => r["cpu"] == "cpu-total")
  |> filter(fn: (r) => r["host"] == "NAMEOFYOURHOST")
  |> aggregateWindow(every: v.windowPeriod, fn: mean, createEmpty: false)
  |> map(fn: (r) => ({ r with _value: r._value * -1.0 + 100.0 }))
  |> toFloat()
  |> yield(name: "mean")
A dashboard preview is visible upon successful query execution.
Step 9 – Configure Alerts and Notifications
Alerts are essential for receiving timely notifications based on metric changes. To integrate email notifications, configure SMTP within /etc/grafana/grafana.ini:
$ sudo nano /etc/grafana/grafana.ini
Modify SMTP settings:
[smtp]
enabled = true
host = email-smtp.us-west-2.amazonaws.com:587
user = YOURUSERNAME
password = YOURUSERPASSWORD
from_address = user@example.com
from_name = HowtoForge Grafana
Save changes and restart Grafana:
$ sudo systemctl restart grafana-server
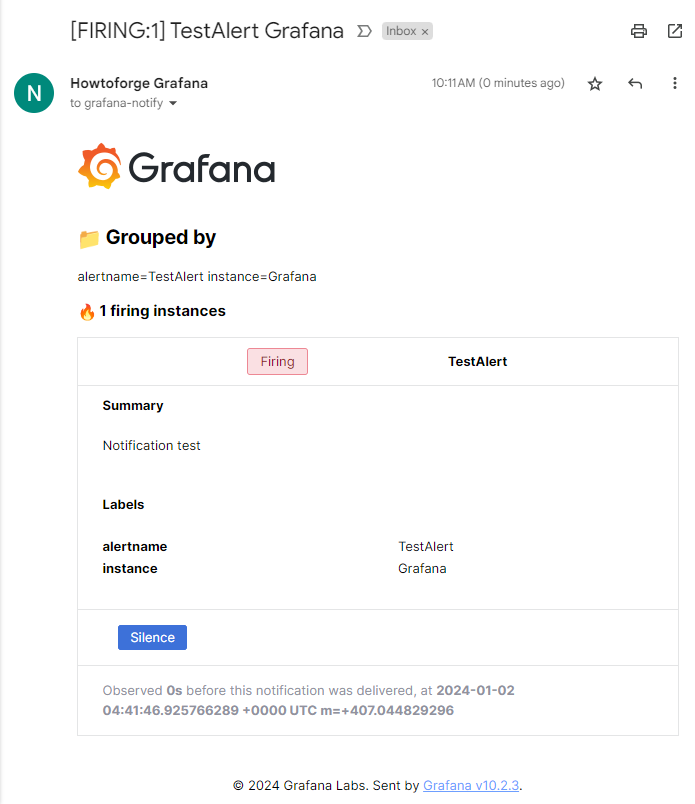
In Grafana, set up contact points via the Alert panel. Test email delivery through configured points. Sample received email:
Determine when alerts will be triggered from dashboard panels. Configure time ranges and trigger conditions under the Alert Panel.
Step 10 – Install Nginx
Rather than Debian 12’s older Nginx version, install a newer Nginx version from its official repository:
Import the signing key:
$ curl https://nginx.org/keys/nginx_signing.key | gpg --dearmor \
    | sudo tee /usr/share/keyrings/nginx-archive-keyring.gpg >/dev/null
Add the mainline repository:
$ echo "deb [signed-by=/usr/share/keyrings/nginx-archive-keyring.gpg] \
http://nginx.org/packages/mainline/debian `lsb_release -cs` nginx" \
    | sudo tee /etc/apt/sources.list.d/nginx.list
Update repository lists and install Nginx:
$ sudo apt update
$ sudo apt install nginx
Verify installation:
$ sudo nginx -v
nginx version: nginx/1.25.3
Start Nginx and confirm its status:
$ sudo systemctl start nginx
$ sudo systemctl status nginx
? nginx.service - nginx - high performance web server
     Loaded: loaded (/lib/systemd/system/nginx.service; enabled; preset: enabled)
     Active: active (running) since Tue 2024-01-02 09:21:10 UTC; 5s ago
       Docs: https://nginx.org/en/docs/
    Process: 12964 ExecStart=/usr/sbin/nginx -c /etc/nginx/nginx.conf (code=exited, status=0/SUCCESS)
   Main PID: 12965 (nginx)
      Tasks: 3 (limit: 2299)
     Memory: 2.9M
        CPU: 86ms
     CGroup: /system.slice/nginx.service
             ??12965 "nginx: master process /usr/sbin/nginx -c /etc/nginx/nginx.conf"
             ??12966 "nginx: worker process"
             ??12967 "nginx: worker process"

Jan 02 09:21:10 grafana systemd[1]: Starting nginx.service - nginx - high performance web server...
Jan 02 09:21:10 grafana systemd[1]: Started nginx.service - nginx - high performance web server.
Step 11 – Install SSL
For generating SSL certificates, leverage Certbot via Snapd:
Install Snapd:
$ sudo apt install snapd
Ensure Snapd is current, install Certbot, and create a symbolic link for certbot:
$ sudo snap install core && sudo snap refresh core
$ sudo snap install --classic certbot
$ sudo ln -s /snap/bin/certbot /usr/bin/certbot
Verify Certbot installation:
$ certbot --version
certbot 2.8.0
Generate an SSL certificate:
$ sudo certbot certonly --nginx --agree-tos --no-eff-email --staple-ocsp --preferred-challenges http -m name@example.com -d grafana.example.com
Store the certificates in the /etc/letsencrypt/live/grafana.example.com directory, including the Diffie-Hellman certificate:
$ sudo openssl dhparam -dsaparam -out /etc/ssl/certs/dhparam.pem 4096
Check snap.certbot.renew.service via the service timer’s list:
$ systemctl list-timers
Conduct a dry run to check if renewal settings are operational:
$ sudo certbot renew --dry-run
Step 12 – Configure Nginx for Grafana and InfluxDB
Insert the following line within Nginx’s config file /etc/nginx/nginx.conf:
server_names_hash_bucket_size 64;
Create and edit the Grafana configuration file at /etc/nginx/conf.d/grafana.conf:
$ sudo nano /etc/nginx/conf.d/grafana.conf
Password protect files on webservers by inserting the following:
map $http_upgrade $connection_upgrade {
    default upgrade;
    '' close;
}

server {

    listen 443 ssl reuseport;
    listen [::]:443 ssl reuseport;

    http2 on;

    server_name grafana.example.com;

    access_log  /var/log/nginx/grafana.access.log;
    error_log   /var/log/nginx/grafana.error.log;

    ssl_certificate      /etc/letsencrypt/live/grafana.example.com/fullchain.pem;
    ssl_certificate_key  /etc/letsencrypt/live/grafana.example.com/privkey.pem;
    ssl_trusted_certificate /etc/letsencrypt/live/grafana.example.com/chain.pem;

    ssl_session_timeout  5m;
    ssl_session_cache shared:MozSSL:10m;
    ssl_session_tickets off;

    ssl_protocols TLSv1.2 TLSv1.3;
    ssl_prefer_server_ciphers on;
    ssl_ciphers ECDHE-ECDSA-AES128-GCM-SHA256:ECDHE-RSA-AES128-GCM-SHA256:ECDHE-ECDSA-AES256-GCM-SHA384:ECDHE-RSA-AES256-GCM-SHA384:ECDHE-ECDSA-CHACHA20-POLY1305:ECDHE-RSA-CHACHA20-POLY1305:DHE-RSA-AES128-GCM-SHA256:DHE-RSA-AES256-GCM-SHA384;
    ssl_ecdh_curve X25519:prime256v1:secp384r1:secp521r1;
    ssl_stapling on;
    ssl_stapling_verify on;
    ssl_dhparam /etc/ssl/certs/dhparam.pem;

    resolver 1.1.1.1 1.0.0.1 [2606:4700:4700::1111] [2606:4700:4700::1001] valid=60s;
    resolver_timeout 2s;

    location / {
        proxy_set_header Host $http_host;
        proxy_pass http://localhost:3000;
    }

    location /api/live {
        proxy_http_version 1.1;
        proxy_set_header Upgrade $http_upgrade;
        proxy_set_header Connection $connection_upgrade;
        proxy_set_header Host $http_host;
        proxy_pass http://localhost:3000;
    }

    location /influxdb/ {
        access_log  /var/log/nginx/influx.access.log;
        error_log   /var/log/nginx/influx.error.log;
        rewrite ^/influxdb$ /influxdb/ permanent;
        rewrite ^/influxdb/(.*)$ /$1 break;
        proxy_cookie_path ~*^/api /influxdb/api;
        proxy_connect_timeout 600s;
        proxy_http_version 1.1;
        proxy_pass http://localhost:8086;
        proxy_read_timeout 600s;
        proxy_send_timeout 600s;
        proxy_set_header Authorization $http_authorization;
        proxy_set_header Connection "upgrade";
        proxy_set_header Host $http_host;
        proxy_set_header Upgrade $http_upgrade;
        proxy_set_header X-Forwarded-For $proxy_add_x_forwarded_for;
        proxy_set_header X-Forwarded-Proto https;
        proxy_set_header X-Real-IP $remote_addr;
        sub_filter '' '';
        sub_filter 'src="/' 'src="/influxdb/';
        sub_filter 'href="/' 'href="/influxdb/';
        sub_filter 'data-basepath="' 'data-basepath="/influxdb/';
        sub_filter 'n.p="/"' 'n.p="/influxdb/"';
        sub_filter 'o.p="/"' 'o.p="/influxdb/"';
        sub_filter '/api/' '/influxdb/api/';
        sub_filter 'api/v2/query' 'influxdb/api/v2/query';
        sub_filter '/health`' '/influxdb/health`';
        sub_filter_types text/css text/javascript application/javascript application/json;
        sub_filter_once off;
    }
}
# enforce HTTPS
server {
    listen 80;
    listen [::]:80;
    server_name grafana.example.com;
    return 301 https://$host$request_uri;
}
Verify and restart Nginx:
$ sudo nginx -t
$ sudo systemctl restart nginx
Configure Telegraf for HTTPS
Edit /etc/telegraf/telegraf.conf; set the URL to a secure endpoint:
urls = ["https://grafana.example.com/influxdb"]
Restart Telegraf:
$ sudo systemctl restart telegraf
Configure Grafana for HTTPS
Modify /etc/grafana/grafana.ini for secure access:
# The public facing domain name used to access grafana from a browser
;domain = localhost
domain = grafana.example.com

# Redirect to correct domain if host header does not match domain
# Prevents DNS rebinding attacks
;enforce_domain = true

# The full public facing url you use in browser, used for redirects and emails
# If you use reverse proxy and sub path specify full url (with sub path)
;root_url = %(protocol)s://%(domain)s:%(http_port)s/
root_url = %(protocol)s://%(domain)s
Restart Grafana:
$ sudo systemctl restart grafana-server
Close Firewall Ports for InfluxDB and Grafana
Close InfluxDB and Grafana ports:
$ sudo ufw delete allow 8086
$ sudo ufw delete allow 3000
Grafana is available at https://grafana.example.com, with InfluxDB UI/API at https://grafana.example.com/influxdb.
Conclusion
This comprehensive guide concludes the implementation of the TIG Stack on a Debian 12 server. Should you have any related questions, feel free to leave them in the comments section below.
Frequently Asked Questions
- What is the TIG Stack used for?
The TIG Stack—Telegraf, InfluxDB, and Grafana—facilitates collecting, storing, visualizing, and alerting system metrics.
- Can I install TIG Stack on other Linux distributions?
Yes, the TIG Stack can be installed on many other Linux distributions with modified installation procedures specific to each distribution.
- How can I troubleshoot TIG Stack installation issues?
Refer to the system logs of each service for error messages or consult the official documentation of the respective software for detailed troubleshooting methods.
- Is data sharing between Telegraf and InfluxDB secured?
Yes, data transmission security is ensured by configuring InfluxDB to communicate over HTTPS.
- How often do I need to renew my SSL certificates?
Typically, SSL certificates must be renewed every 90 days. However, Certbot automates this renewal process.
