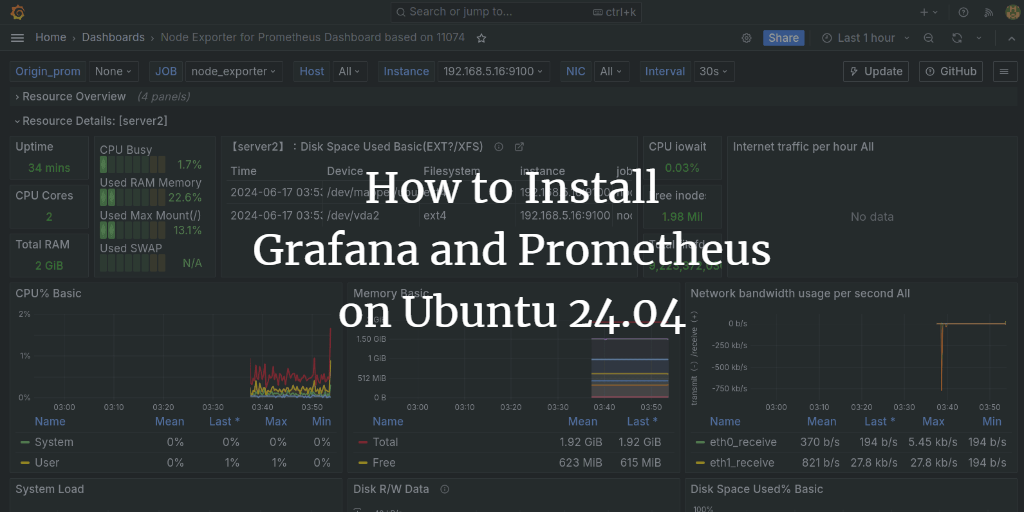
Grafana is a robust, open-source, multi-platform data visualization platform developed by Grafana Labs. It provides an intuitive web application for visualizing data through interactive charts, graphs, and alerts. Grafana allows you to query, visualize, set up alerts, and explore metrics, logs, and traces of time-series databases, turning your data into insightful visuals.
Grafana supports adding your time-series database data through ‘Data Sources.’ It is compatible with a variety of data sources, including Prometheus, InfluxDB, PostgreSQL, Loki, Jaeger, Graphite, Google Cloud Monitoring, AWS CloudWatch, and Azure Monitor, among others.
This tutorial guides you through installing Grafana, Prometheus, and node_exporter on Ubuntu 24.04 servers. The tutorial also covers setting up Nginx as a reverse proxy for Grafana, integrating node_exporter with Prometheus, and adding Prometheus as a data source to the Grafana dashboard.
Prerequisites
Before starting, ensure you have the following:
- Two or three Ubuntu 24.04 servers.
- A non-root user with administrative privileges.
Installing Grafana on Ubuntu
To install Grafana, you’ll need to add its repository. During this process, Nginx will also be set up as a reverse proxy for Grafana.
Installing Dependencies and Adding Repository
In this step, you’ll install necessary dependencies and add the Grafana repository.
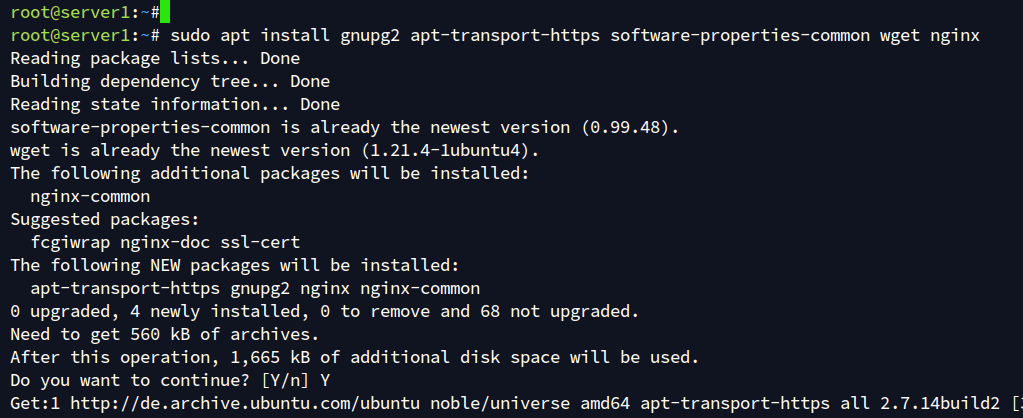
Run the following command to install dependencies. Confirm installation by typing Y when prompted.
sudo apt install gnupg2 apt-transport-https software-properties-common wget nginx
Add the Grafana GPG key and repository using the following commands:
wget -q -O - https://packages.grafana.com/gpg.key > grafana.key cat grafana.key | gpg --dearmor | sudo tee /etc/apt/trusted.gpg.d/grafana.gpg > /dev/null
echo 'deb [signed-by=/etc/apt/trusted.gpg.d/grafana.gpg] https://packages.grafana.com/oss/deb stable main' | sudo tee /etc/apt/sources.list.d/grafana.list
Refresh your package index with:
sudo apt update

Installing and Configuring Grafana
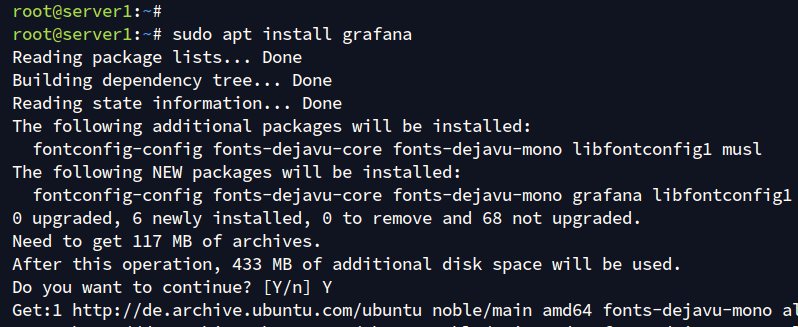
With the repository added, install Grafana using APT. After installation, configure Grafana to run locally.
sudo apt install grafana
Reload the systemd manager:
sudo systemctl daemon-reload
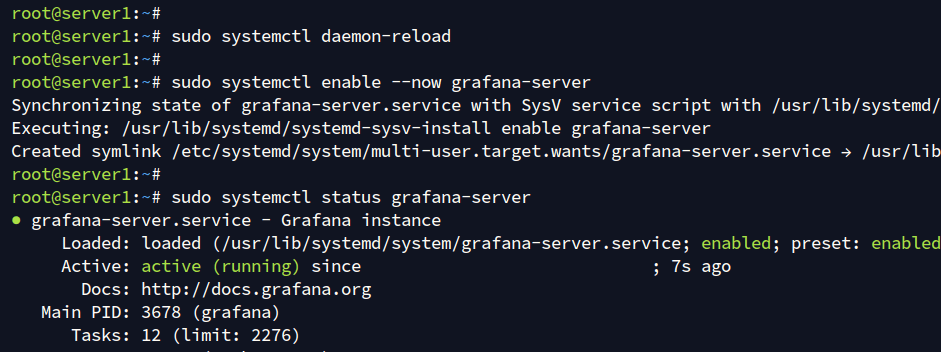
Start and enable the grafana-server, then verify it:
sudo systemctl enable --now grafana-server
sudo systemctl status grafana-server
Edit the Grafana configuration file to run on your domain (e.g., hwdomain.io):
sudo nano /etc/grafana/grafana.ini
[server]

    # Bind address
    http_addr = localhost

    # Port
    http_port = 3000

    # Domain name
    domain = hwdomain.io
After saving your changes, restart Grafana:
sudo systemctl restart grafana-server
Setting Up Nginx as a Reverse Proxy
Create an Nginx server block for Grafana:
sudo nano /etc/nginx/sites-available/grafana.conf
# Proxy configuration
    map $http_upgrade $connection_upgrade {
      default upgrade;
      '' close;
    }

    server {
        listen 80;
        server_name hwdomain.io;

      root /usr/share/nginx/html;
      index index.html index.htm;

      access_log /var/log/nginx/grafana-access.log;
      error_log /var/log/nginx/grafana-error.log;

      location / {
        proxy_set_header Host $http_host;
        proxy_pass http://localhost:3000/;
      }

      # Proxy WebSockets
      location /api/live {
        rewrite  ^/(.*)  /$1 break;
        proxy_http_version 1.1;
        proxy_set_header Upgrade $http_upgrade;
        proxy_set_header Connection $connection_upgrade;
        proxy_set_header Host $http_host;
        proxy_pass http://localhost:3000/;
      }
    }
Activate the new configuration and check Nginx:
sudo ln -s /etc/nginx/sites-available/grafana.conf /etc/nginx/sites-enabled/
sudo nginx -t

Restart Nginx to apply the changes:
sudo systemctl restart nginx
sudo systemctl status nginx
After verifying Nginx is running, navigate to your domain (e.g., http://hwdomain.io/) to access the Grafana login page.
Log in using admin for both username and password, then set a new password:

Installing and Configuring Prometheus
Set up Prometheus for monitoring and alerting by manually installing its latest version.
Installing Prometheus
Create a system user and directories for Prometheus:
sudo groupadd --system prometheus
sudo useradd -s /sbin/nologin --system -g prometheus prometheus
sudo mkdir -p /var/lib/prometheus
for i in rules rules.d files_sd; do sudo mkdir -p /etc/prometheus/${i}; done
Download and unzip the latest Prometheus binary:
curl -s https://api.github.com/repos/prometheus/prometheus/releases/latest|grep browser_download_url|grep linux-amd64|cut -d ‘"’ -f 4|wget -qi -
tar xvf prometheus*.tar.gz
cd prometheus*/
Move it to the appropriate directories:
sudo mv prometheus promtool /usr/local/bin/
sudo mv consoles console_libraries prometheus.yml /etc/prometheus/
Change the directories’ permissions:
for i in rules rules.d files_sd; do sudo chown -R prometheus:prometheus /etc/prometheus/${i}; done
for i in rules rules.d files_sd; do sudo chmod -R 775 /etc/prometheus/${i}; done
sudo chown -R prometheus:prometheus /var/lib/prometheus/

Configuring Prometheus
Enhance security with basic authentication:
sudo apt install apache2-utils -y
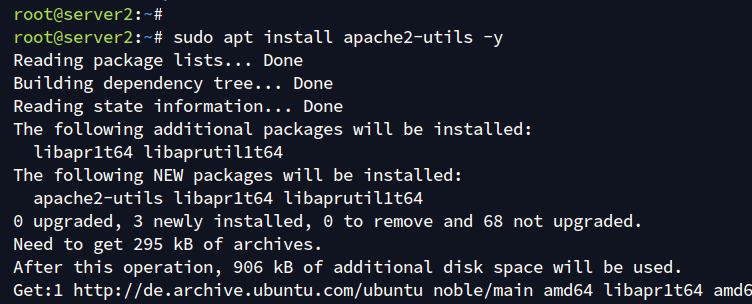
Generate and copy a bcrypt password for user admin:
htpasswd -nB admin
Edit/create a basic auth file:
sudo nano /etc/prometheus/web.yml
# basic_auth
    basic_auth_users:
      admin: $2y$05$s8U/BrE5JhSO31XKSbtj8u8cPECULs3emEhlDfCB2GW1UefQ9x00C
Edit the main configuration file:
sudo nano /etc/prometheus/prometheus.yml
scrape_configs:
      # The job name is added as a label `job=` to any timeseries scraped from this config.
      - job_name: "prometheus"

        # metrics_path defaults to '/metrics'
        basic_auth:
          username: "admin"
          password: "password"

        static_configs:
          - targets: ["localhost:9090"]
Running Prometheus as a Systemd Service
Create a new systemd service file for Prometheus:
sudo nano /etc/systemd/system/prometheus.service
[Unit]
    Description=Prometheus
    Documentation=https://prometheus.io/docs/introduction/overview/
    Wants=network-online.target
    After=network-online.target

    [Service]
    Type=simple
    User=prometheus
    Group=prometheus
    ExecReload=/bin/kill -HUP $MAINPID
    ExecStart=/usr/local/bin/prometheus \
     --config.file=/etc/prometheus/prometheus.yml \
     --storage.tsdb.path=/var/lib/prometheus \
     --web.console.templates=/etc/prometheus/consoles \
     --web.console.libraries=/etc/prometheus/console_libraries \
     --web.listen-address=0.0.0.0:9090 \
     --web.config.file=/etc/prometheus/web.yml \

    SyslogIdentifier=prometheus
    Restart=always

    [Install]
    WantedBy=multi-user.target
Reload systemd and manage Prometheus as a service:
sudo systemctl daemon-reload
sudo systemctl enable --now prometheus
sudo systemctl status prometheus

Installing Node Exporter
Deploy node_exporter to get basic system metrics:
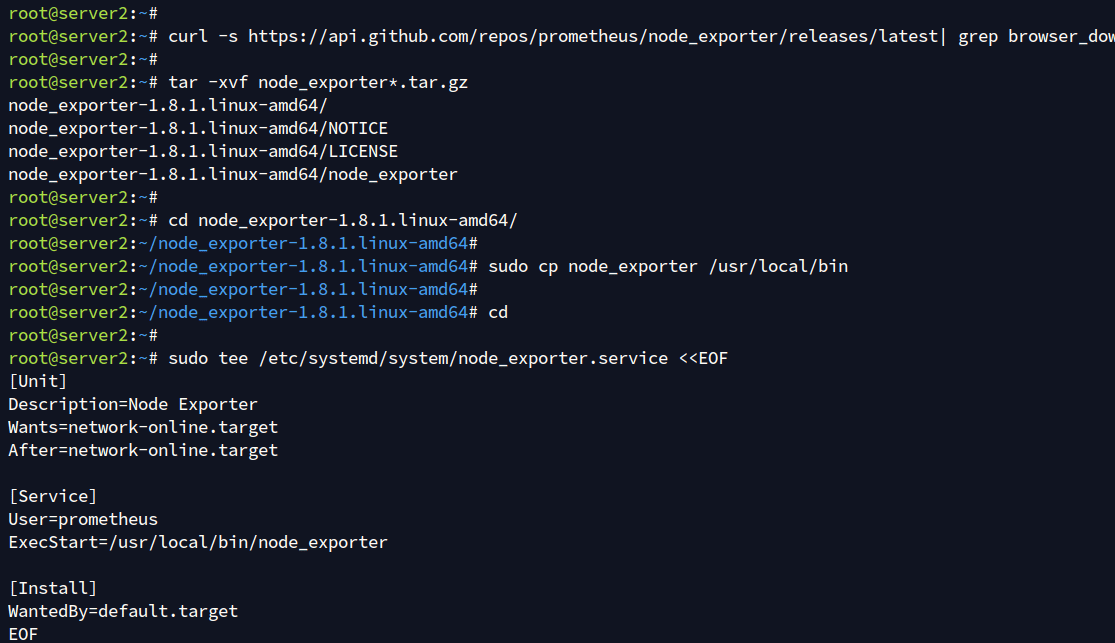
curl -s https://api.github.com/repos/prometheus/node_exporter/releases/latest|grep browser_download_url|grep linux-amd64|cut -d ‘"’ -f 4|wget -qi -
tar -xvf node_exporter*.tar.gz
cd node_exporter*/
sudo cp node_exporter /usr/local/bin
Set up node_exporter as a systemd service:
sudo tee /etc/systemd/system/node_exporter.service <<EOF
[Unit]
Description=Node Exporter
Wants=network-online.target
After=network-online.target
[Service]
User=prometheus
ExecStart=/usr/local/bin/node_exporter

[Install]
WantedBy=default.target
EOF
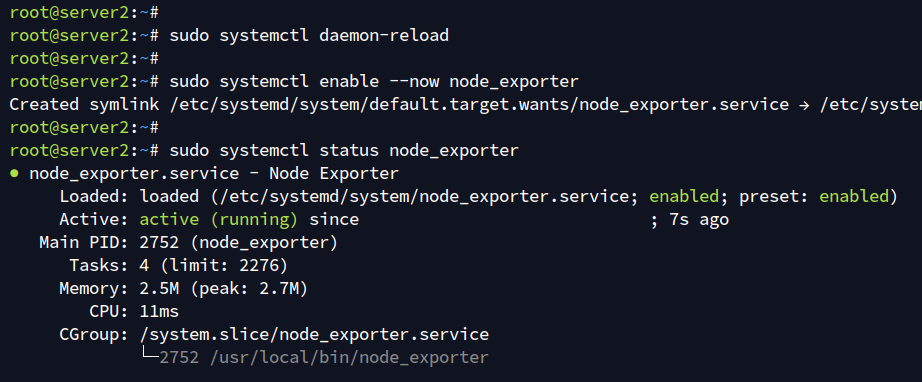
Reload systemd and launch node_exporter:
sudo systemctl daemon-reload
sudo systemctl enable --now node_exporter
sudo systemctl status node_exporter
Integrating Node Exporter to Prometheus
Open Prometheus’ configuration file:
sudo nano /etc/prometheus/prometheus.yml
Add node_exporter configuration:
  - job_name: "node_exporter"

      static_configs:
        - targets: ["192.168.5.100:9100"]
Restart Prometheus:
sudo systemctl restart prometheus
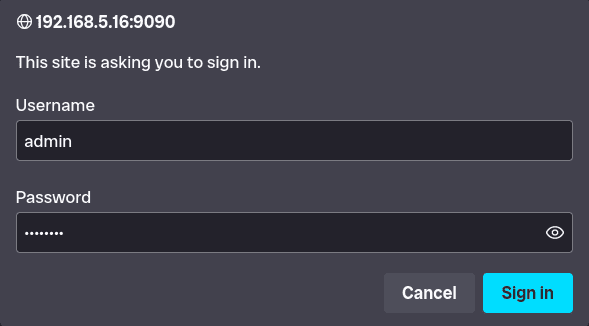
Access the Prometheus web interface at http://192.168.5.16:9090, use basic authentication to log in, execute queries, and check the integration status.
Integrating Prometheus with Grafana as a Data Source
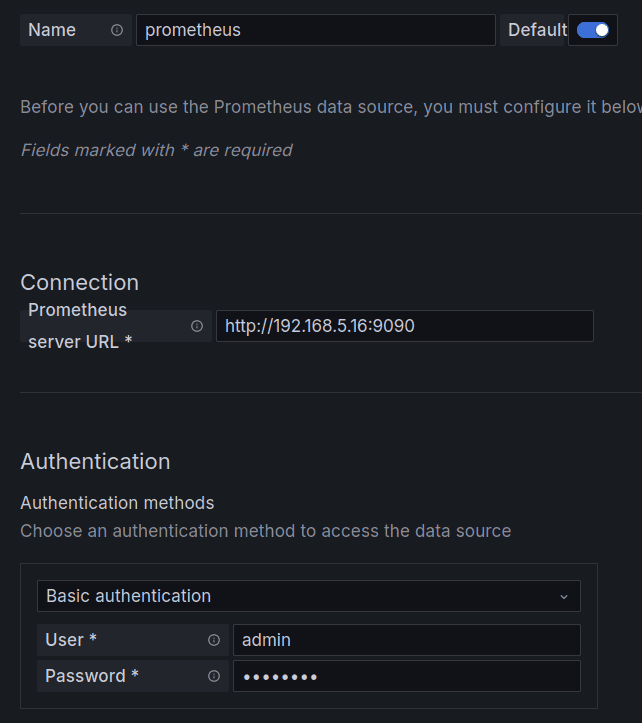
In Grafana, add Prometheus as a data source:
Within Grafana: Connections > Data Sources > Add data source

Provide Prometheus details such as the URL and authentication credentials:
http://192.168.5.16:9090/
Test the connection, and upon successful configuration, create a new Grafana dashboard using provided templates.
Conclusion
Congratulations! You’ve completed the installation of Grafana, Prometheus, and Node Exporter on Ubuntu 24.04 servers. Your Grafana is operational with Nginx as a reverse proxy, Prometheus is securely set with password authentication, Node Exporter is integrated with Prometheus, and you’ve added Prometheus as a data source to Grafana, with dashboards in place for monitoring.
Frequently Asked Questions (FAQ)
- What is Grafana?
- Grafana is a multi-platform open-source analytics and interactive visualization web application. It provides charts, graphs, and alerts for the web when connected to supported data sources.
- What are the prerequisites for installing Grafana on Ubuntu?
- You need two or three Ubuntu 24.04 servers and a non-root user with administrative privileges.
- How can I secure Prometheus with basic authentication?
- By installing the
apache2-utilspackage and configuring a bcrypt password using thehtpasswdcommand. - What is node_exporter used for?
- Node Exporter is used for collecting and exposing system metrics for Prometheus, such as system utilization, file system statistics, and more.
- How can I integrate Prometheus with Grafana?
- Add Prometheus as a data source in Grafana through ‘Connections > Data Sources > Add Data Source’, and provide the necessary connection details and credentials.
