Grafana is an open-source, feature-rich metrics dashboard and graph editor. It is widely used for monitoring a large number of metrics from various data sources like MySQL, MongoDB, and InfluxDB among others. Its pluggable architecture allows for extensive customization through numerous plugins.
Written in Scala, Grafana uses Elasticsearch for data persistence and supports querying across different data sources. It can visualize metrics from your own applications or third-party services like Pingdom, Google Analytics, and AWS Cloudwatch.
Features of Grafana
- Dashboard Editor: Features a robust graphical editor with a drag-and-drop interface for building dashboards. Grafana’s API access allows real-time deployment of dashboards.
- Multiple Data Sources: Supports data sources like Graphite, InfluxDB, and Prometheus. It’s extendable via plugins for other sources such as MySQL and Elasticsearch, with frequent updates by community contributors.
- Data Visualizations: Offers various visualization types, including Graphs, Tables, and Charts. Complex dashboards can be created using smaller dashlets.
- Dashboard Sharing: Allows easy sharing of dashboards online. They can be exported as JSON files or downloaded in PNG format.
Understanding Grafana
Grafana integrates with tools like Graphite, addressing its limitations in metric collection through a more efficient process using InfluxDB for storage. It collects and stores data via Elasticsearch, facilitating fast querying with its plugin architecture supporting numerous third-party data sources.
This guide will walk you through installing and configuring Grafana on Ubuntu 20.04 (also applicable to other versions).
Prerequisite
- Ubuntu 20.04 64-bit server.
- Log in as root or with sudo privileges.
- At least 200MB of disk space, 3GB of RAM, and 2 CPUs.
Getting Started
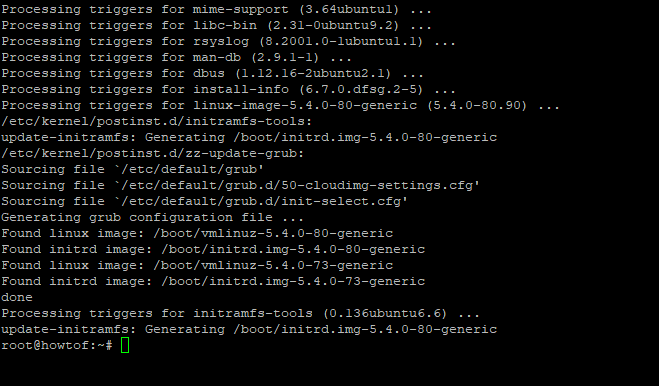
Updating Your Server
Before beginning, update your server with:
sudo apt update -y
sudo apt upgrade -y
These commands will update package lists and upgrade all packages to the latest versions. You may need to reboot the server afterward:
sudo reboot
Installing Dependencies
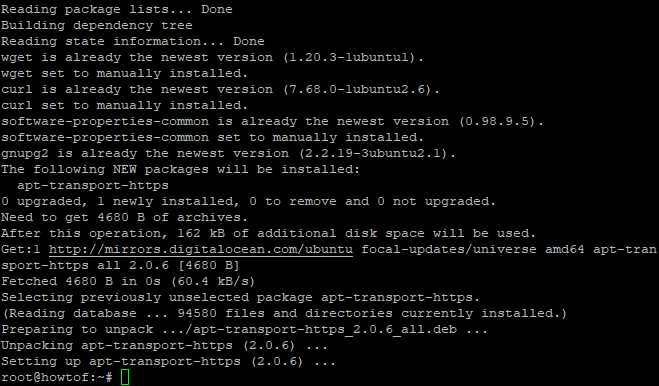
Install necessary packages:
sudo apt-get install -y gnupg2 curl software-properties-common apt-transport-https wget
These packages facilitate GPG key generation, data transfer, and handling HTTPS sources for apt-get.
Installing Grafana
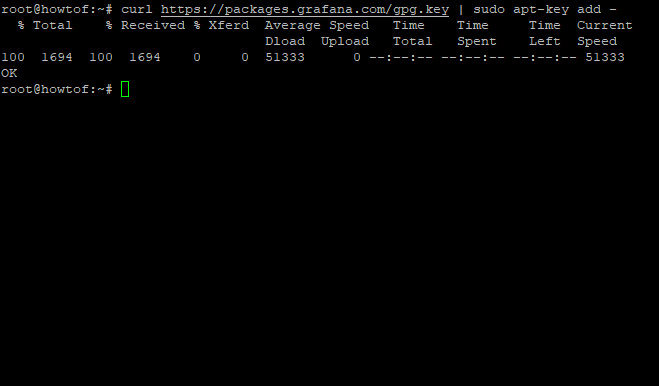
To install Grafana, first import the GPG key:
curl https://packages.grafana.com/gpg.key | sudo apt-key add -
Next, add the repository:
sudo add-apt-repository "deb https://packages.grafana.com/oss/deb stable main"

Then, update repositories and install Grafana:
sudo apt update
sudo apt install grafana -y
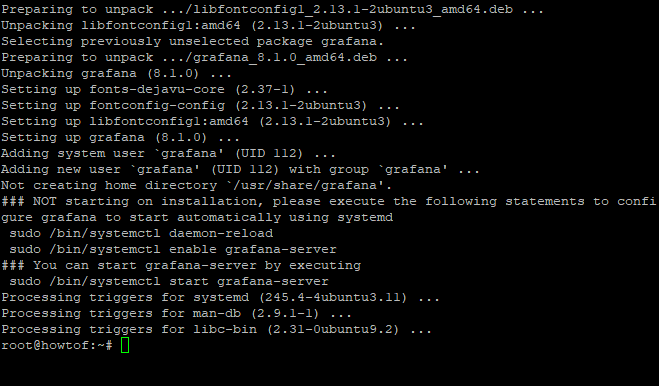
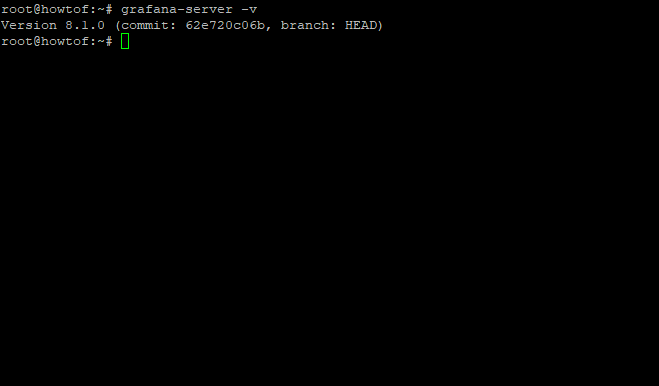
Verify installation:
grafana-server -v
Starting Grafana Service
The Grafana service should start automatically. If not, start it manually:
sudo systemctl start grafana-server
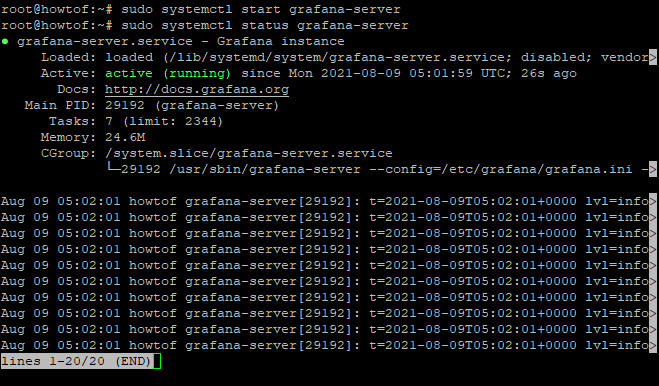
Check its status:
sudo systemctl status grafana-server
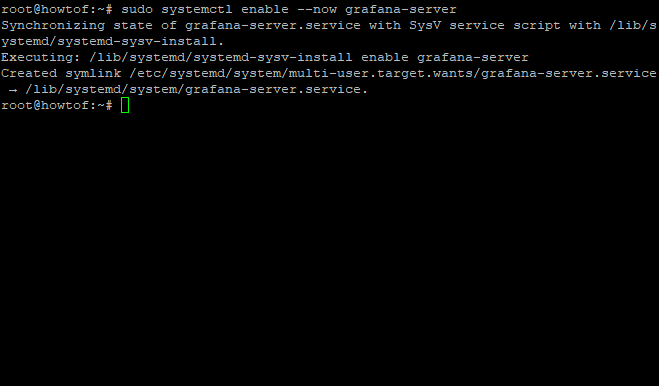
Enable Grafana to start on boot:
sudo systemctl enable --now grafana-server
Configuring Firewall
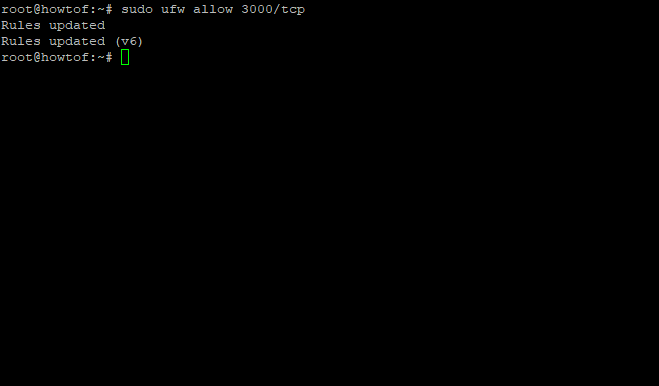
Ensure UFW allows Grafana through port 3000:
sudo ufw allow 3000/tcp
Verify rules:
sudo ufw status
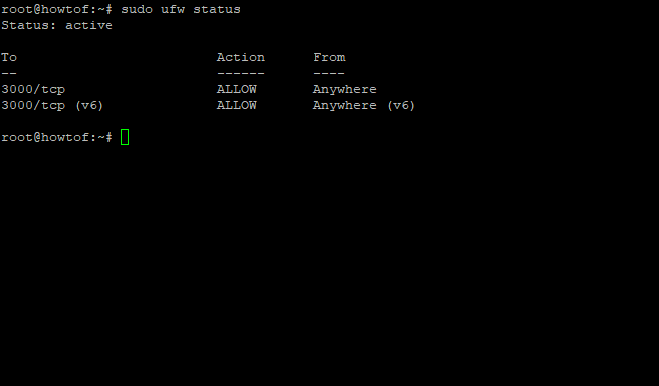
Accessing Grafana Web Interface
Access Grafana through a web browser at http://localhost:3000 or http://my-ip-address:3000 if accessing it from another computer. Replace “my-ip-address” with your server’s IP.
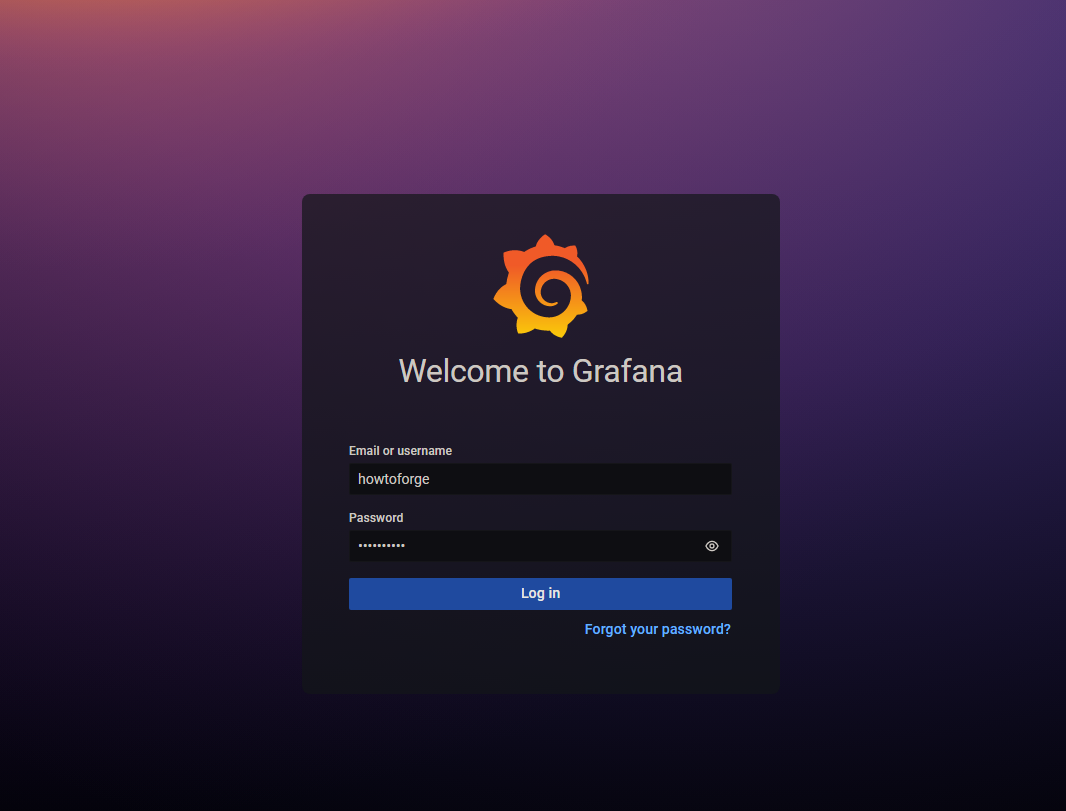
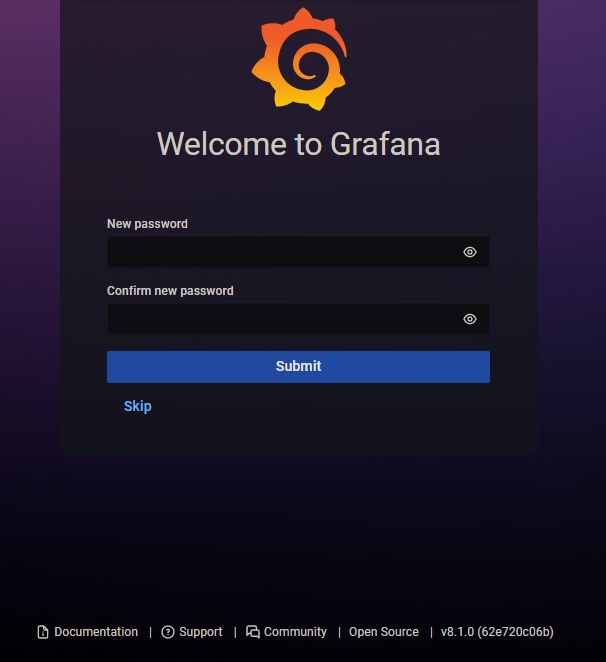
Log in using default credentials (admin/admin) and change your password when prompted:
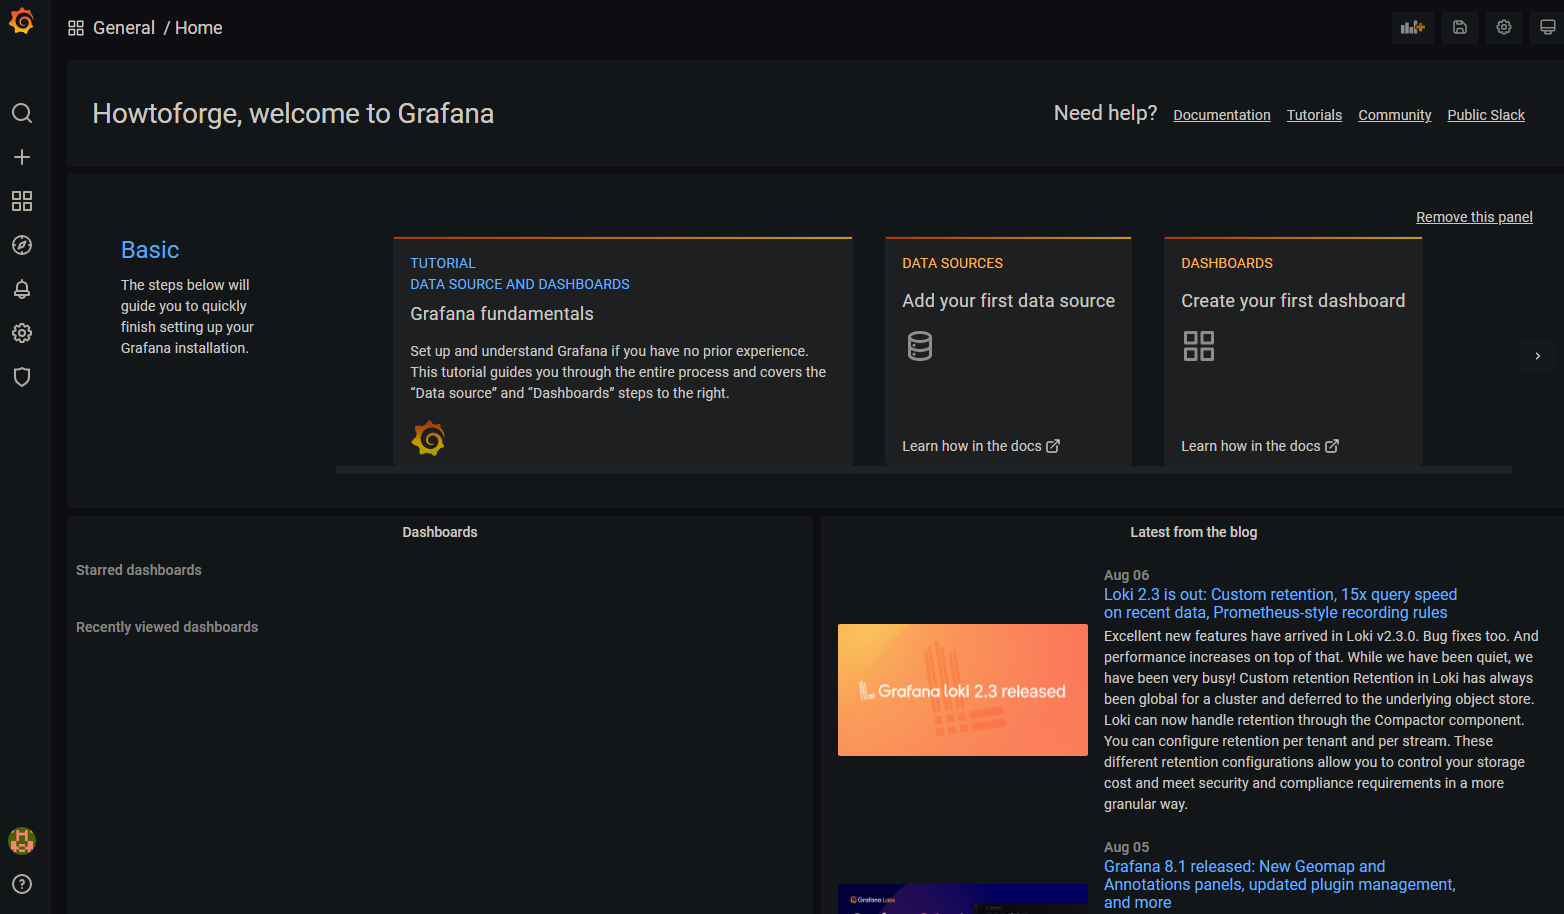
Upon logging in, you will be presented with a dashboard containing sample data.
Conclusion
Grafana is an excellent open-source tool for visualizing various data types. It’s an invaluable asset for monitoring and managing data metrics effectively. For further details, refer to the Grafana documentation.
Frequently Asked Questions (FAQ)
- What is Grafana?Grafana is an open-source visualization and analytics software that allows you to query, visualize, alert on, and explore your data using customizable dashboards.
- What are Grafana’s system requirements?Grafana requires a 64-bit Ubuntu system, with at least 200 MB disk space, 3 GB of RAM, and 2 CPUs.
- How do you access the Grafana web interface?After installation and configuration, you can access the web interface at
http://localhost:3000orhttp://your-IP-address:3000. - Is it necessary to use UFW with Grafana?While not strictly necessary, using UFW helps manage firewall rules effectively, ensuring access to Grafana’s required ports.
- How can I get more information about Grafana?Visit the Grafana documentation at https://grafana.com/docs for detailed information and guides.
If you found this article helpful, please share it with your network. For questions or feedback, leave a comment below. Thank you for reading!