Grafana is a robust, open-source platform for metrics visualization and dashboarding. This versatile tool is ideal for monitoring data collected from Graphite, Elasticsearch, OpenTSDB, Prometheus, and InfluxDB. It’s a multi-platform solution offering over 100 plugins for data collection, storage, visualization, and sharing. Grafana enhances collaboration with alert features and comprehensive sharing functionalities.
This guide provides a step-by-step installation process for Grafana 8 on Ubuntu 22.04.
Prerequisites
- An Ubuntu 22.04 server.
- A domain name correctly pointing to your server’s IP address.
- Root access configured on your server.
Getting Started
It’s essential to begin with an up-to-date system. Update all packages by executing:
apt-get update -y
apt-get upgrade -y
After updating, install necessary dependencies with:
apt-get install gnupg2 curl wget git software-properties-common -y
Once these packages are installed, proceed to the installation of Grafana.
Install Grafana 8 on Ubuntu 22.04
Grafana isn’t included in the default Ubuntu repositories, so you’ll need to add its repository:
curl https://packages.grafana.com/gpg.key | apt-key add -
add-apt-repository "deb https://packages.grafana.com/oss/deb stable main"
Now update the repository cache and install Grafana:
apt-get update -y
apt-get install grafana -y
Start and enable the Grafana service:
systemctl start grafana-server
systemctl enable grafana-server
To verify the Grafana service status, run:
systemctl status grafana-server
You should see an output indicating it’s active:
? grafana-server.service - Grafana instance
     Loaded: loaded (/lib/systemd/system/grafana-server.service; disabled; vendor preset: enabled)
     Active: active (running) since Sat 2022-08-06 09:33:06 UTC; 7s ago
       Docs: http://docs.grafana.org
   Main PID: 69737 (grafana-server)
      Tasks: 9 (limit: 2242)
     Memory: 37.1M
        CPU: 1.580s
     CGroup: /system.slice/grafana-server.service
             ??69737 /usr/sbin/grafana-server --config=/etc/grafana/grafana.ini --pidfile=/run/grafana/grafana-server.pid --packaging=deb cfg>
Grafana uses port 3000. Check this by running:
ss -antpl | grep 3000
You should see:
LISTEN 0 4096 *:3000 *:* users:(("grafana-server",pid=69737,fd=8))
Install Nginx as a Reverse Proxy for Grafana
To allow access through port 80, set up Nginx as a reverse proxy. Install it via:
apt-get install nginx -y
Create an Nginx configuration file:
nano /etc/nginx/conf.d/grafana.conf
Enter the following configuration:
server {
        server_name grafana.example.com;
        listen 80;
        access_log /var/log/nginx/grafana.log;

        location / {
                proxy_pass http://localhost:3000;
                proxy_set_header Host $http_host;
                proxy_set_header X-Forwarded-Host $host:$server_port;
                proxy_set_header X-Forwarded-Server $host;
                proxy_set_header X-Forwarded-For $proxy_add_x_forwarded_for;
        }
    }
After saving the file, check for syntax errors:
nginx -t
Expected output:
nginx: the configuration file /etc/nginx/nginx.conf syntax is ok
nginx: configuration file /etc/nginx/nginx.conf test is successful
Restart Nginx to apply changes:
systemctl restart nginx
Verify Nginx status:
systemctl status nginx
You should see:
? nginx.service - A high performance web server and a reverse proxy server
     Loaded: loaded (/lib/systemd/system/nginx.service; enabled; vendor preset: enabled)
     Active: active (running) since Sat 2022-08-06 09:35:32 UTC; 4s ago
       Docs: man:nginx(8)
    Process: 70326 ExecStartPre=/usr/sbin/nginx -t -q -g daemon on; master_process on; (code=exited, status=0/SUCCESS)
    Process: 70327 ExecStart=/usr/sbin/nginx -g daemon on; master_process on; (code=exited, status=0/SUCCESS)
   Main PID: 70328 (nginx)
      Tasks: 2 (limit: 2242)
     Memory: 2.6M
        CPU: 42ms
     CGroup: /system.slice/nginx.service
             ??70328 "nginx: master process /usr/sbin/nginx -g daemon on; master_process on;"
             ??70329 "nginx: worker process" "" "" "" "" "" "" "" "" "" "" "" "" "" "" "" "" "" "" "" "" "" "" "" "" "" "" ""
Nginx is now set up as a reverse proxy. Proceed to the dashboard access.
Access Grafana Dashboard
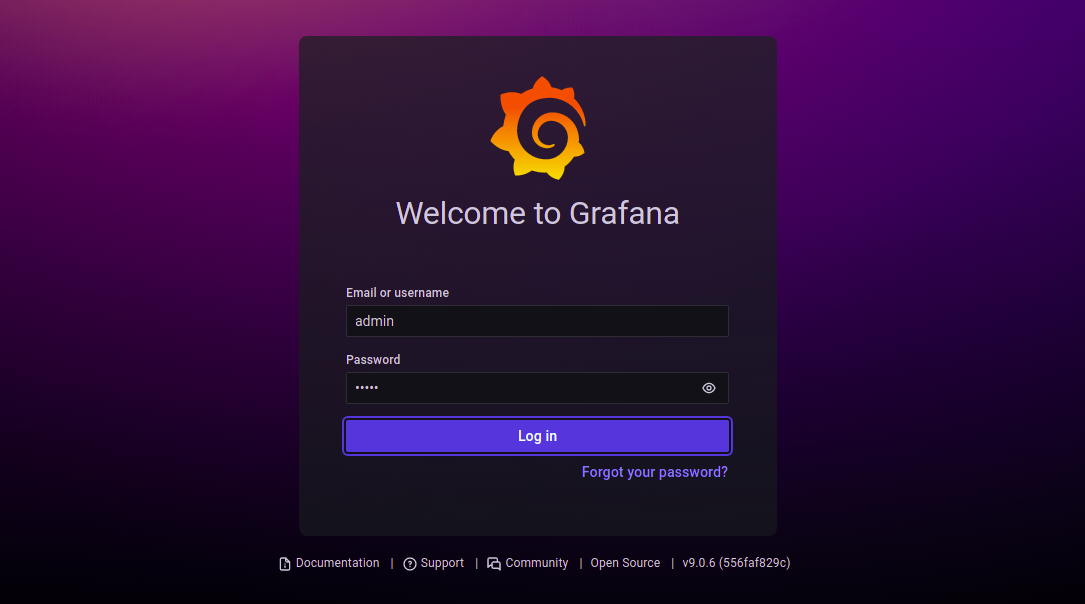
Access Grafana by navigating to http://grafana.example.com in your browser. You should arrive at the login page:

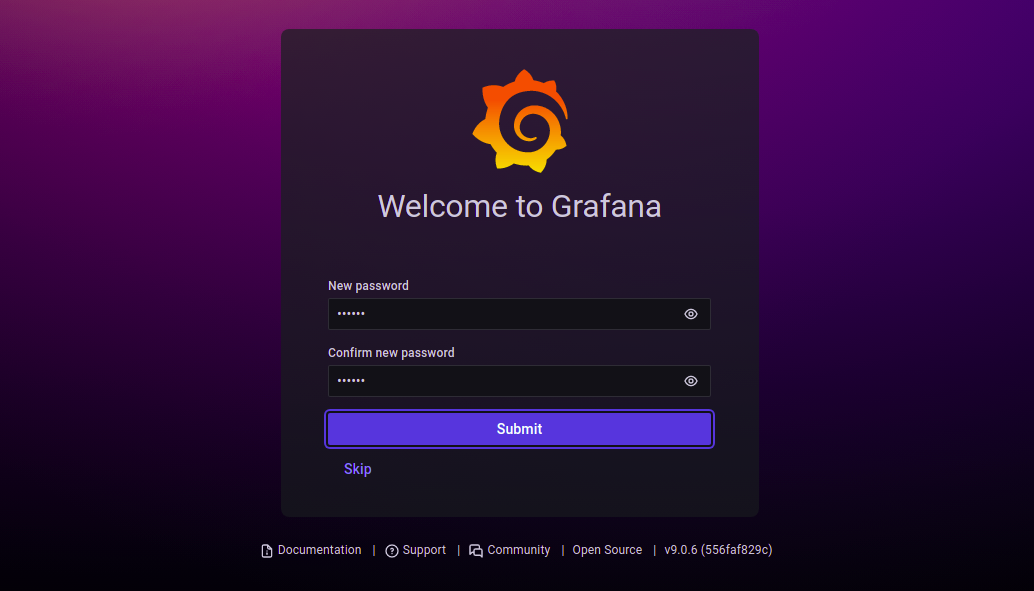
Log in using “admin” as both the username and password. Change the password when prompted:

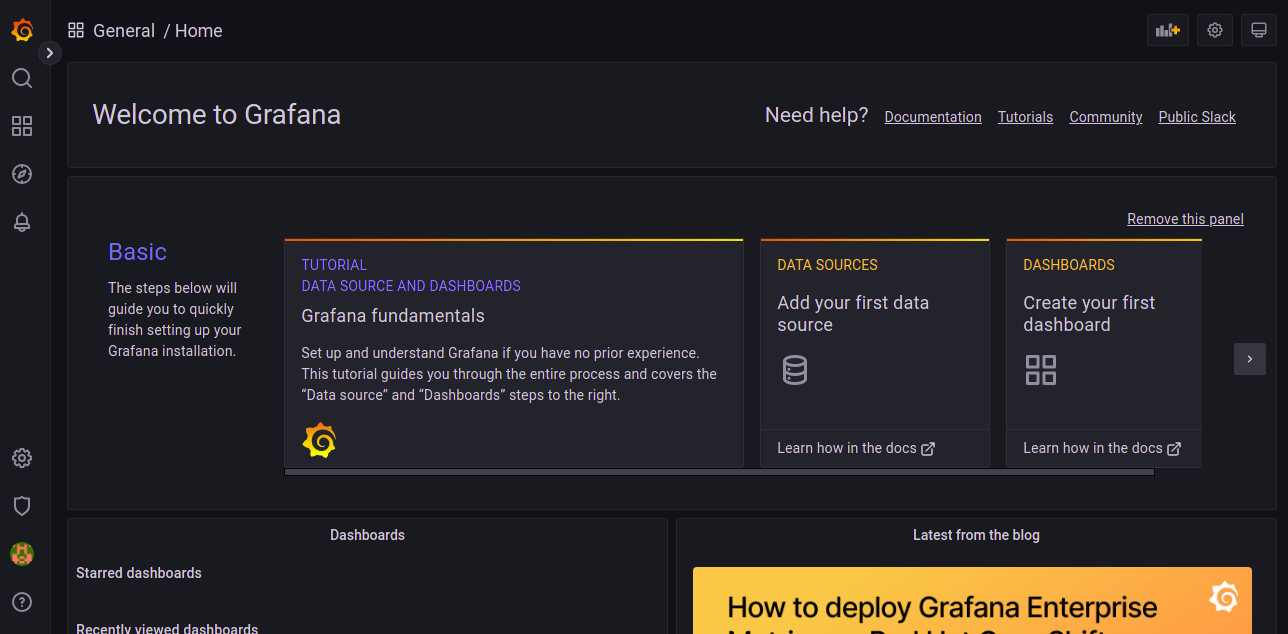
Once you’ve reset your password, you’ll be redirected to the dashboard:

Secure Grafana with Let’s Encrypt
To secure Grafana, install the Certbot client to manage Let’s Encrypt SSL certificates:
apt-get install certbot python3-certbot-nginx -y
Once installed, proceed to request an SSL certificate:
certbot --nginx -d grafana.example.com
Follow the prompts to enter your email and agree to terms:
Saving debug log to /var/log/letsencrypt/letsencrypt.log
Plugins selected: Authenticator nginx, Installer nginx
Enter email address (used for urgent renewal and security notices) (Enter 'c' to cancel): hitjethva@gmail.com
Choose whether to redirect HTTP traffic to HTTPS. Select option 2 for redirection:
- - - - - - - - - - - - - - - - - - - - - - - - - - - - - - - - - - - - - - - -
1: No redirect - Make no further changes to the webserver configuration.
2: Redirect - Make all requests redirect to secure HTTPS access. Choose this for
new sites, or if you're confident your site works on HTTPS. You can undo this
change by editing your web server's configuration.
- - - - - - - - - - - - - - - - - - - - - - - - - - - - - - - - - - - - - - - -
Select the appropriate number [1-2] then [enter] (press 'c' to cancel): 2
Concluding the setup, you’ll receive a confirmation message:
Congratulations! You have successfully enabled https://grafana.example.com
Configuration details and certificate expiry information will be provided.
Conclusion
You’ve successfully installed and secured Grafana 8 on Ubuntu 22.04, using Nginx as a reverse proxy with Let’s Encrypt SSL. Now, integrate your data sources and leverage Grafana to its full potential for comprehensive monitoring. Should you have any questions, feel free to ask.
Frequently Asked Questions
- What should I do if I can’t access Grafana? — Check your Nginx and Grafana configurations to ensure there are no errors. Reviewing logs in /var/log/nginx/ and systemctl status grafana-server can help diagnose issues.
- Can Grafana run on a different port? — Yes, you can configure Grafana to run on a different port by editing the /etc/grafana/grafana.ini file and specifying a different port in the [server] section.
- How do I renew the SSL certificate? — The certbot package handles auto-renewals for LetsEncrypt certificates. Ensure that certbot is set up correctly to automatically renew the certificate. You can test this by running certbot renew –dry-run.
