Prometheus is an open-source monitoring system that enables you to collect metrics from various configured target systems. It boasts a multi-dimensional data model, powerful queries, impressive visualization, and precise alerting. It’s highly versatile, thanks to numerous integrations.
Originally developed by SoundCloud in 2012, Prometheus has evolved into an independent open-source project maintained by the community. All components are available under the Apache 2 License on GitHub.
This tutorial will guide you through installing and configuring Prometheus alongside Node Exporter. We’ll set up Prometheus to monitor server metrics using CentOS 7.
Prerequisites
- CentOS 7 server
- Root privileges
Objectives
- Create a new user and download Prometheus
- Configure Prometheus as a Systemd service
- Configure Firewalld
- Install and configure Node Exporter
- Add Node Exporter to the Prometheus Server
- Perform testing
Step 1 – Create a New User and Download Prometheus
We’ll run the Prometheus service under a non-root user for enhanced security. Start by creating a new user named ‘prometheus’:
useradd -m -s /bin/bash prometheus
Log in as the new user and download Prometheus using wget:
su - prometheus
wget https://github.com/prometheus/prometheus/releases/download/v2.2.1/prometheus-2.2.1.linux-amd64.tar.gz
Extract and rename the downloaded file:
tar -xzvf prometheus-2.2.1.linux-amd64.tar.gz
mv prometheus-2.2.1.linux-amd64/ prometheus/
Your Prometheus files should reside in /home/prometheus/prometheus.
Step 2 – Configure Prometheus as a Systemd Service
Create a Systemd service to manage Prometheus easily. In the /etc/systemd/system directory, create a new service file:
cd /etc/systemd/system/
vim prometheus.service
Insert the following configuration:
  [Unit]
  Description=Prometheus Server
  Documentation=https://prometheus.io/docs/introduction/overview/
  After=network-online.target

  [Service]
  User=prometheus
  Restart=on-failure

  # Modify this line if Prometheus is downloaded elsewhere
  ExecStart=/home/prometheus/prometheus/prometheus \
    --config.file=/home/prometheus/prometheus/prometheus.yml \
    --storage.tsdb.path=/home/prometheus/prometheus/data

  [Install]
  WantedBy=multi-user.target
Save and exit the editor. Reload the Systemd configuration and enable Prometheus:
systemctl daemon-reload
systemctl start prometheus
systemctl enable prometheus

Verify Prometheus is running:
systemctl status prometheus
Or use netstat to check the listening ports:
netstat -plntu
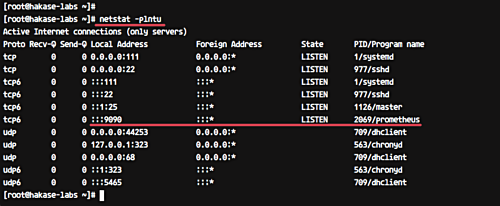
Ensure Prometheus is active on port 9090.
Step 3 – Configure Firewalld
If you’re using Firewalld, allow access through port 9090:
firewall-cmd --add-port=9090/tcp --permanent
firewall-cmd --reload
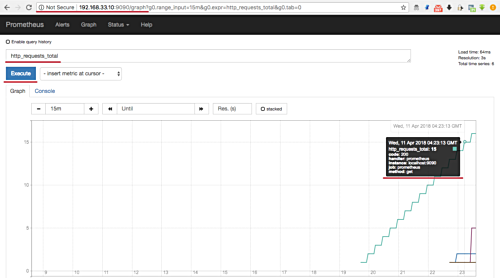
Access Prometheus’ interface by entering your server IP in a web browser:
http://192.168.33.10:9090/graph
Run a test query, like ‘http_requests_total,’ to visualize metrics:
Step 4 – Install and Configure Node Exporter
Node Exporter collects machine metrics. Install it on the same server as Prometheus:
su - prometheus
wget https://github.com/prometheus/node_exporter/releases/download/v0.16.0-rc.1/node_exporter-0.16.0-rc.1.linux-amd64.tar.gz
Extract and rename the directory:
tar -xzvf node_exporter-0.16.0-rc.1.linux-amd64.tar.gz
mv node_exporter-0.16.0-rc.1.linux-amd64 node_exporter
Create a new Systemd service file for Node Exporter:
cd /etc/systemd/system/
vim node_exporter.service
Add the following configuration:
  [Unit]
  Description=Node Exporter
  Wants=network-online.target
  After=network-online.target

  [Service]
  User=prometheus
  ExecStart=/home/prometheus/node_exporter/node_exporter

  [Install]
  WantedBy=default.target
Save, exit, reload Systemd, and start Node Exporter:
systemctl daemon-reload
systemctl start node_exporter
systemctl enable node_exporter

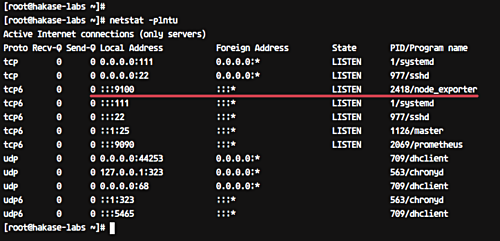
Confirm Node Exporter is running, checking for activity on port 9100:
netstat -plntu
Step 5 – Add Node Exporter to the Prometheus Server
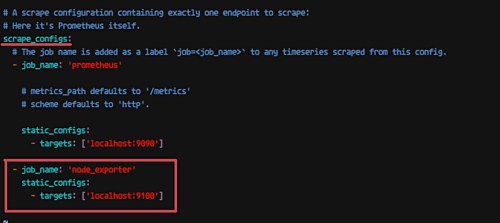
Link Node Exporter to Prometheus by editing prometheus.yml:
su - prometheus
cd prometheus/
vim prometheus.yml
Add the following under scrape_config:
  - job_name: 'node_exporter'
    static_configs:
      - targets: ['localhost:9100']
Restart Prometheus to apply changes:
systemctl restart prometheus
Step 6 – Testing Prometheus and Node Exporter
Open Prometheus in your browser:
http://192.168.33.10:9090/
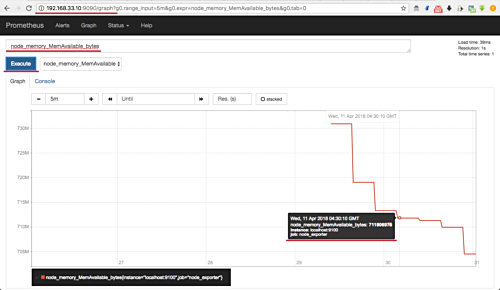
To see memory metrics, enter:
node_memory_MemAvailable_bytes
This should display available server memory metrics collected by Node Exporter:
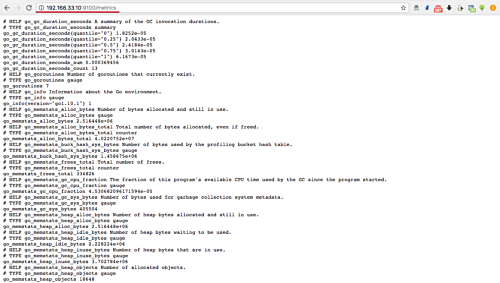
To access Node Exporter raw data, ensure port 9100 is open:
firewall-cmd --add-port=9100/tcp
firewall-cmd --reload
Connect via:
http://192.168.33.10:9100/metrics
This completes the installation and configuration of Prometheus and Node Exporter on CentOS 7.
References
FAQs
- What is Prometheus?
- Prometheus is an open-source monitoring and alerting toolkit, offering a robust solution for collecting and querying metrics from applications and systems.
- Why use Node Exporter?
- Node Exporter is ideal for collecting hardware and kernel metrics from your system, providing data that can be used by Prometheus for monitoring.
- Can Prometheus monitor remote systems?
- Yes, Prometheus can scrape metrics from remote systems where exporters are set up and configured.
- Is Prometheus a replacement for traditional monitoring tools?
- While highly effective, Prometheus is often used alongside other tools, providing complementary monitoring capabilities, especially within distributed environments.
- Do I need root access to install Prometheus?
- Root access simplifies the setup process, especially for system configurations and modifying firewall rules. However, Prometheus itself runs as a non-root user for security reasons.
