Prometheus is a powerful open-source monitoring and alerting platform originally developed by SoundCloud in 2012. Over the years, it has flourished into a robust project, supported by a vibrant community and maintained under the Cloud Native Computing Foundation (CNCF) since 2016.
Understanding Basic Concepts
Prometheus operates by collecting metrics from configured targets at given intervals, storing them in a time series database. Metrics are identified by metric names and key/value pairs. Its flexibility is enhanced by the Prometheus Query Language (PromQL), enabling complex queries to extract time-series metrics.
To gather data from targets, you’ll install an exporter on each server. The Node Exporter is popular for monitoring Linux systems, exposing hardware and operating system metrics.
Prerequisites
This guide details installing Prometheus and Node Exporter on a Rocky Linux 8 system.
Ensure you meet the following prerequisites:
- Operating System: Rocky Linux 8.5 (Green Obsidian)
- Root privileges
In this tutorial, we use a system with the IP address 192.168.1.10.
Create New User and Directory Structure
Start by creating a new system user and necessary directories for Prometheus:
Create a new user ‘prometheus’:
sudo adduser -M -r -s /sbin/nologin prometheus
Create configuration and data directories:
sudo mkdir /etc/prometheus
sudo mkdir /var/lib/prometheus
Configuration files reside in ‘/etc/prometheus’, while data is stored in ‘/var/lib/prometheus’.
Installing Prometheus on Rocky Linux
We’ll manually install Prometheus from the tarball. Visit the Prometheus releases page to select the desired version. In this guide, we use the latest available version:
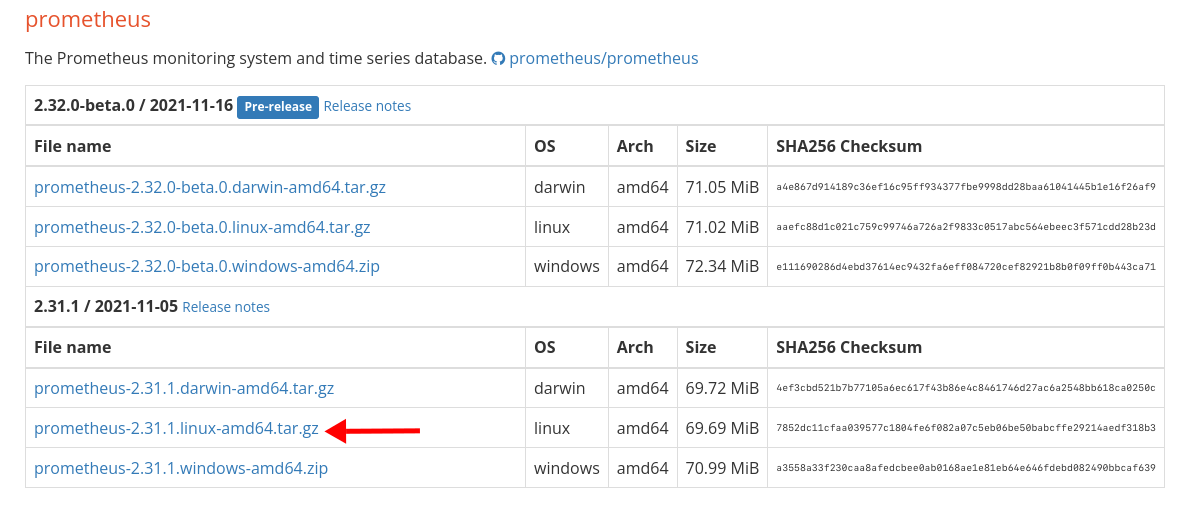
Change directory and download Prometheus binary:
cd /usr/src
wget https://github.com/prometheus/prometheus/releases/download/v2.31.1/prometheus-2.31.1.linux-amd64.tar.gz
Extract the downloaded tarball:
tar -xf prometheus-2.31.1.linux-amd64.tar.gz
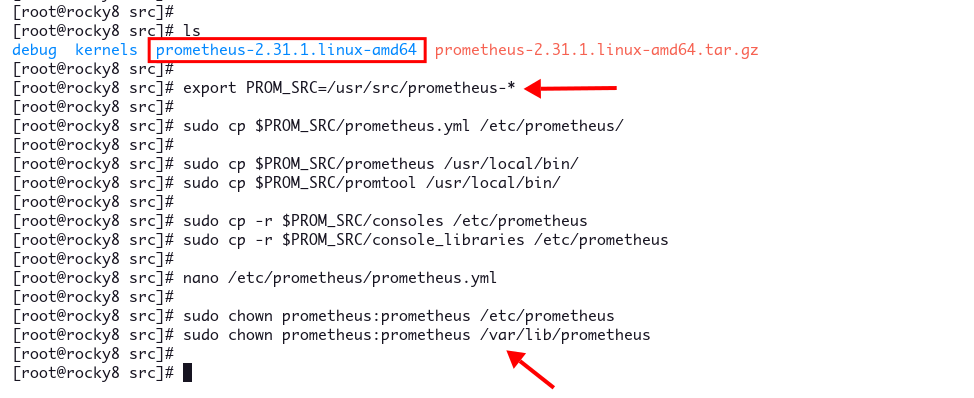
Copy configurations and binaries:
export PROM_SRC=/usr/src/prometheus-*
sudo cp $PROM_SRC/prometheus.yml /etc/prometheus/
sudo cp $PROM_SRC/prometheus /usr/local/bin/
sudo cp $PROM_SRC/promtool /usr/local/bin/
sudo cp -r $PROM_SRC/consoles /etc/prometheus
sudo cp -r $PROM_SRC/console_libraries /etc/prometheus
Edit the Prometheus configuration file:
nano /etc/prometheus/prometheus.yml
Modify the target to reflect your server IP address:
            scrape_configs:
              - job_name: "prometheus"
                static_configs:
                  - targets: ["192.168.1.10:9090"]
Change ownership of directories:
            sudo chown prometheus:prometheus /etc/prometheus
            sudo chown prometheus:prometheus /var/lib/prometheus
With this, Prometheus is installed and configured.
Setting Up Prometheus as a Systemd Service
Create a systemd service file:
sudo nano /etc/systemd/system/prometheus.service
Insert the following configuration:
            [Unit]
            Description=Prometheus
            Wants=network-online.target
            After=network-online.target

            [Service]
            User=prometheus
            Group=prometheus
            Type=simple
            ExecStart=/usr/local/bin/prometheus \
              --config.file /etc/prometheus/prometheus.yml \
              --storage.tsdb.path /var/lib/prometheus/ \
              --web.console.templates=/etc/prometheus/consoles \
              --web.console.libraries=/etc/prometheus/console_libraries

            [Install]
            WantedBy=multi-user.target
Reload systemd and start the service:
            sudo systemctl daemon-reload
            sudo systemctl enable --now prometheus
            sudo systemctl status prometheus
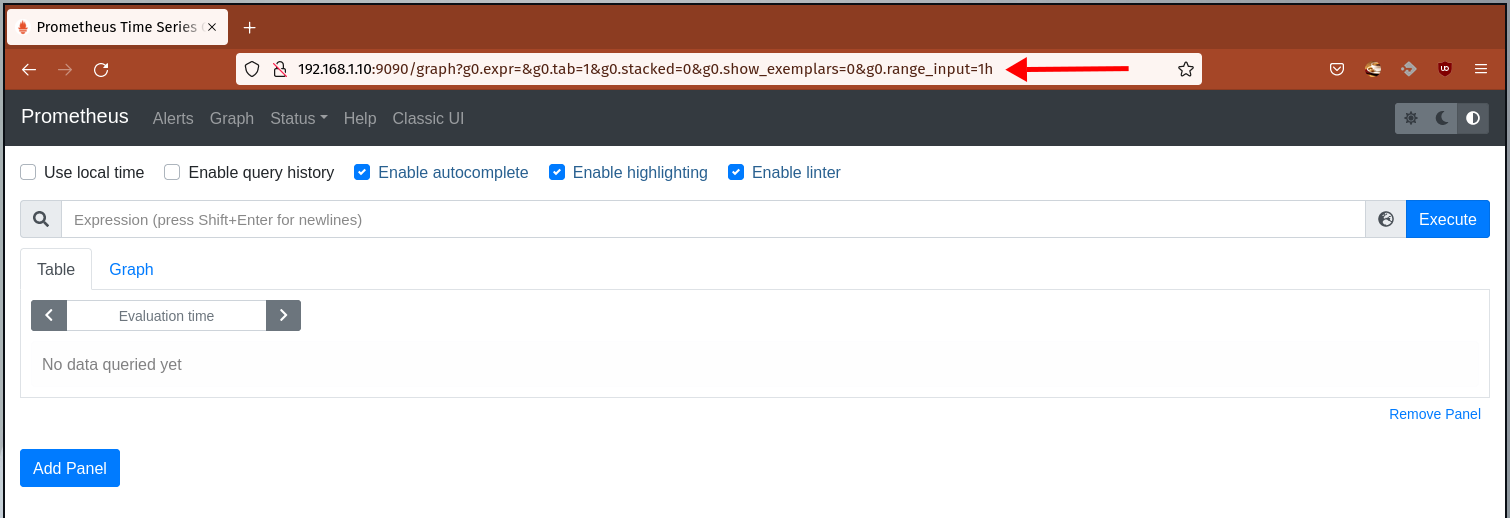
The Prometheus service should now be active, accessible at http://192.168.1.10:9090/.

Navigate to the URL to view the Prometheus dashboard.
Installing Node Exporter on Rocky Linux
The Node Exporter provides essential system metrics for Prometheus. Download the suitable version from the Node Exporter release page. This guide installs version 1.3.0:

-
- Change directory and download Node Exporter binary:
            cd /usr/src/
            wget https://github.com/prometheus/node_exporter/releases/download/v1.3.0/node_exporter-1.3.0.linux-amd64.tar.gz
Extract the downloaded tarball:
tar -xf node_exporter-1.3.0.linux-amd64.tar.gz
Move the binary to the binary directory:
mv node_exporter-*/node_exporter /usr/local/bin
Setting Up Node Exporter as a Systemd Service
Create a new system user for Node Exporter:
sudo adduser -M -r -s /sbin/nologin node_exporter
Create a systemd service file:
sudo nano /etc/systemd/system/node_exporter.service
Add the configuration:
            [Unit]
            Description=Node Exporter
            After=network.target

            [Service]
            User=node_exporter
            Group=node_exporter
            Type=simple
            ExecStart=/usr/local/bin/node_exporter

            [Install]
            WantedBy=multi-user.target
Reload systemd and start the Node Exporter service:
            sudo systemctl daemon-reload
            sudo systemctl enable --now node_exporter
            sudo systemctl status node_exporter
Node Exporter listens on port 9100.

Integrating Node Exporter with Prometheus
Edit Prometheus configuration to add Node Exporter:
sudo nano /etc/prometheus/prometheus.yml
Add a scraping job for Node Exporter:
            - job_name: 'node_exporter_metrics'
              scrape_interval: 5s
              static_configs:
                - targets: ['192.168.1.10:9100']
Restart Prometheus to apply the changes:
sudo systemctl restart prometheus
Verify Installation
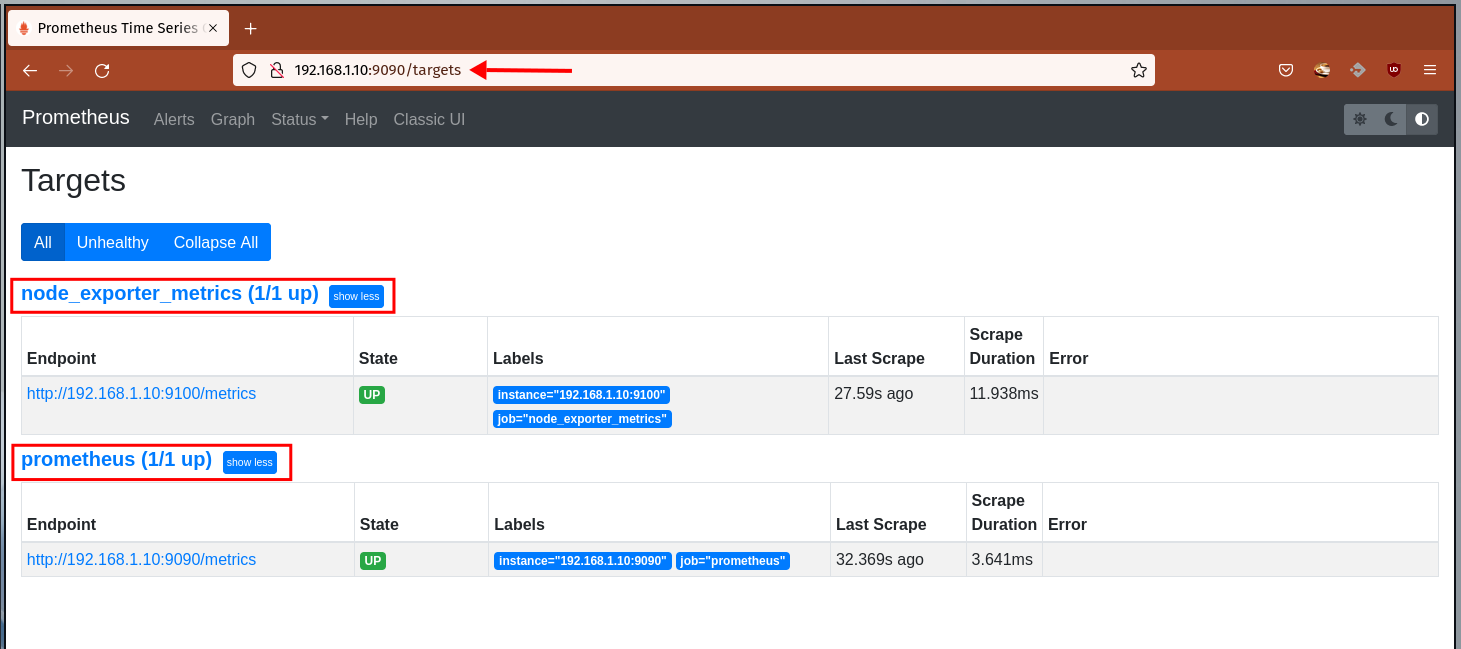
Visit the Prometheus dashboard and choose ‘Status‘ > ‘Targets‘ to confirm the endpoints:
-
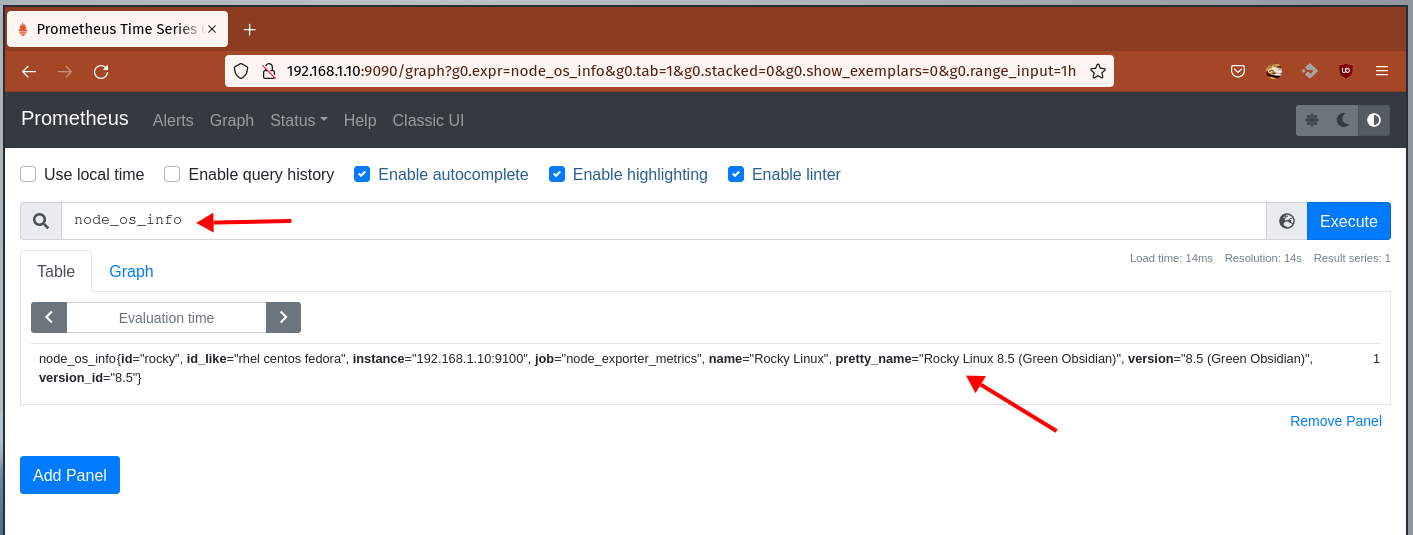
- Try querying node_os_info on the Graph tab to see OS details:
-
- Explore network speeds with node_network_speed_bytes:
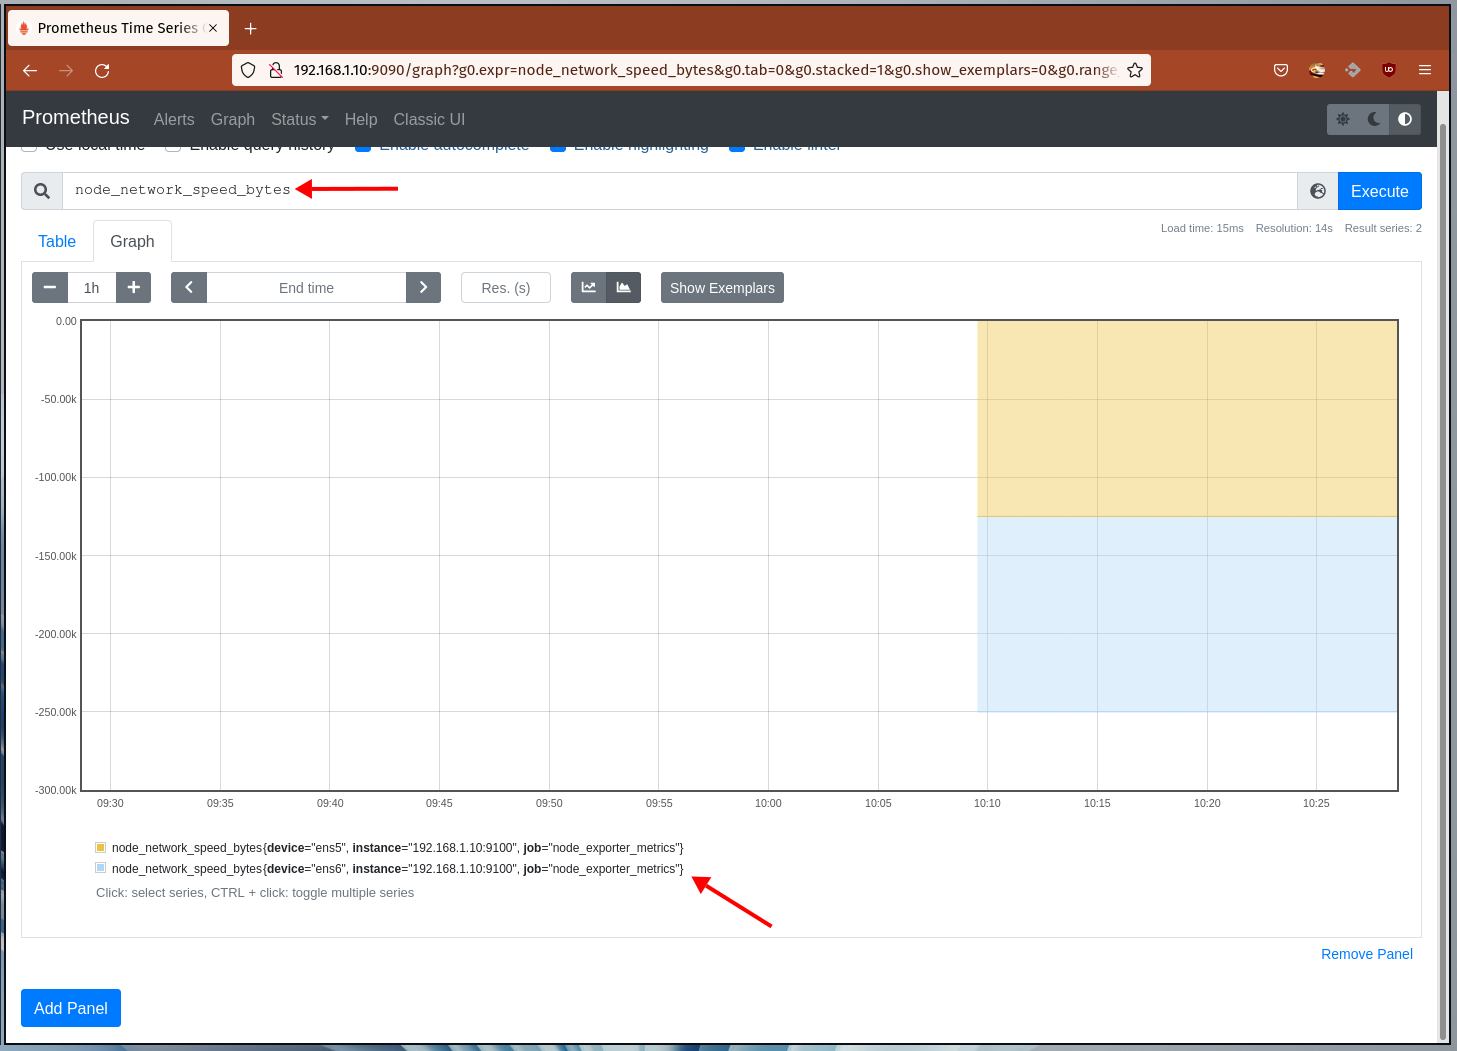
You’ve successfully set up Prometheus and Node Exporter on Rocky Linux.
Conclusion
Well done! You have installed and configured Prometheus and Node Exporter on your Rocky Linux system. Explore other exporters and integrate Grafana for enhanced dashboard capabilities.
Frequently Asked Questions (FAQ)
What is Prometheus used for?
Prometheus is used for monitoring and alerting purposes, offering rich data collection and querying capabilities that enable you to track system performance and diagnose potential issues proactively.
Why install Node Exporter?
Node Exporter gathers essential hardware and OS metrics that allow Prometheus to effectively monitor system performance and resource utilization on Linux servers.
How do I access Prometheus?
You can access Prometheus through a web browser at the server’s IP address and port 9090. For example: http://192.168.1.10:9090/.
Can I integrate Grafana with Prometheus?
Yes, Grafana can be used as a comprehensive visualization tool for Prometheus data, enhancing your ability to create custom dashboards for better insight into system metrics.
