Netdata is an open-source monitoring system tailored for Linux servers. It offers real-time performance and health monitoring supported by a visually appealing dashboard and analytics. Compatible with a myriad of Linux distributions, including Alpine Linux, Arch Linux, CentOS, and Ubuntu, Netdata facilitates real-time health monitoring for servers, CPUs, memory usage, IPv4 and IPv6 networks, and user applications such as Nginx, fail2ban, MySQL, and MongoDB.
This guide will walk you through monitoring Nginx using Netdata on CentOS 7, detailing Nginx web server installation, enabling the ‘stub_status’ module, and installing Netdata.
Steps Covered
- Install Nginx Web Server.
- Enable Nginx ‘stub_status’ Module.
- Install Netdata on CentOS 7.
- Monitor Nginx using Netdata.
- Testing and Verification.
Prerequisites
- CentOS 7 Server
- Root privileges
Step 1 – Install Nginx Web Server
First, we will install the Nginx web server using the EPEL (Extra Packages for Enterprise Linux) repository. Ensure the EPEL repository is already installed on your server. If it’s not, use the following command:
yum -y install epel-release

Then, install Nginx with the yum command:
yum -y install nginx
Start the service and enable it to run automatically at boot:
    systemctl start nginx
    systemctl enable nginx
To allow HTTP and HTTPS traffic, update the firewall settings:
    firewall-cmd --add-service=http --permanent
    firewall-cmd --add-service=https --permanent
    firewall-cmd --reload

Note: If firewall-cmd is not available, install firewalld packages:
yum -y install firewalld
The Nginx web server is now installed.
Step 2 – Enable Nginx stub_status Module
To monitor Nginx using Netdata, enable the ‘stub_status’ module. Confirm ‘stub_status’ is supported by your Nginx version:
nginx -V

Locate ‘stub_status’ in the output list, indicating its availability.
Edit ‘nginx.conf’ to enable ‘stub_status’:
    cd /etc/nginx/
    vim nginx.conf
Add the following within the ‘server {}‘ block:
    location /stub_status {
      stub_status;
      # Security: Only allow access from the IP below.
      allow 127.0.0.1;
      # Deny anyone else
      deny all;
    }
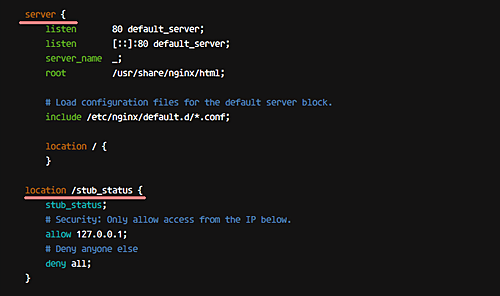
Save and exit. Validate the configuration, then restart Nginx:
    nginx -t
    systemctl restart nginx

Confirm ‘stub_status’ availability using:
curl http://127.0.0.1/stub_status

Step 3 – Install Netdata on CentOS 7
First, install necessary packages:
yum -y install zlib-devel libuuid-devel libmnl-devel gcc make git autoconf autogen automake pkgconfig curl jq nodejs
Download the Netdata source code with git:
    cd ~
    git clone https://github.com/firehol/netdata.git --depth=1
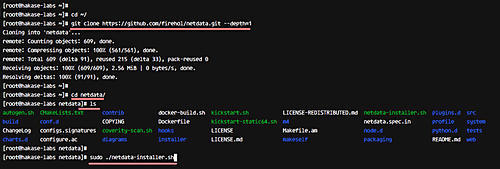
Navigate to the Netdata directory and execute the installer script:
    cd netdata/
    sudo ./netdata-installer.sh
Press ‘Enter’ to initiate the installation.
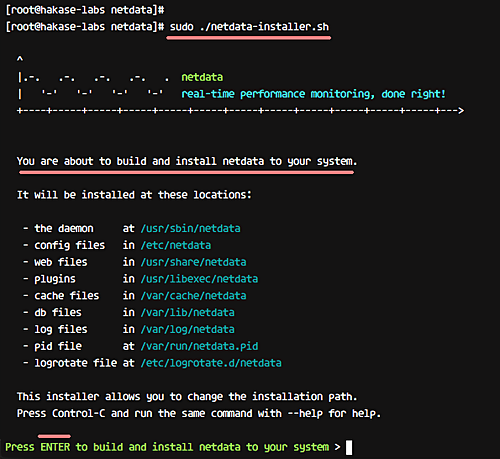
After installation, you should see:
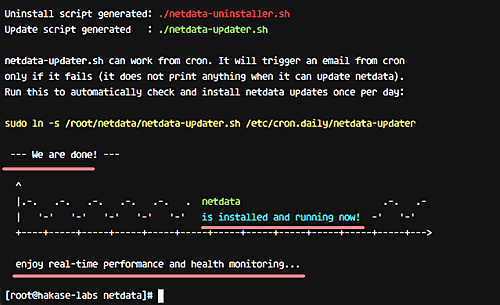
Netdata runs on port ‘19999’. Open it on the firewall:
    sudo firewall-cmd --permanent --add-port=19999/tcp
    sudo firewall-cmd --reload
Use systemd to manage Netdata:
    systemctl restart netdata
    systemctl enable netdata
Check if port 19999 is in ‘LISTEN’ state:
netstat -plntu
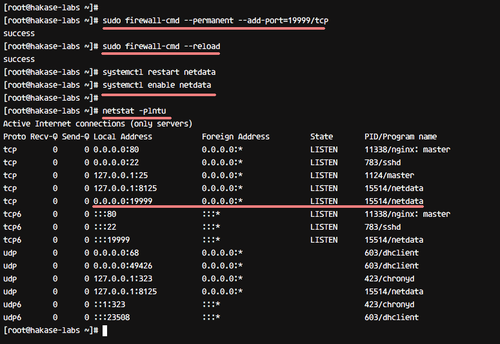
Netdata is ready for use on CentOS 7.
Step 4 – Monitor Nginx using Netdata
With Nginx and ‘stub_status’ ready, and Netdata installed, we aim to monitor Nginx’s requests, active connections, and status.
Configure Netdata’s python module for monitoring:
    cd /etc/netdata/python.d/
    vim nginx.conf
Ensure the configuration includes:
    localhost:
      name : 'local'
      url  : 'http://localhost/stub_status'
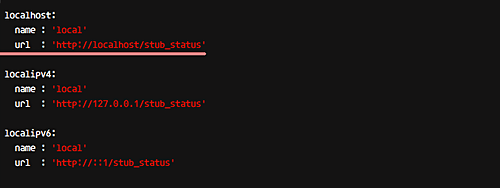
Save, exit, and restart Netdata:
systemctl restart netdata
Step 5 – Testing and Verification
Access Netdata by opening your browser and navigating to:
http://192.168.1.11:19999/
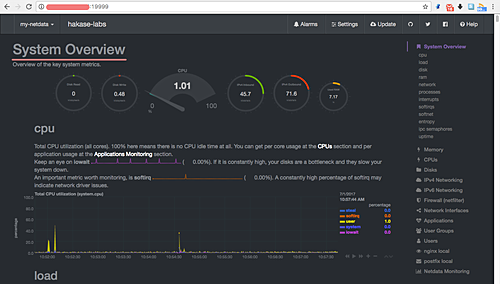
Select ‘nginx local’ to view active connections, requests, status, and connection rates.
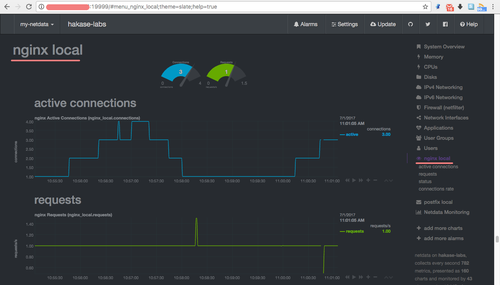
Netdata successfully monitors your Nginx server on CentOS 7.
Reference
FAQ
- What do I do if I can’t access Netdata’s dashboard?
Ensure port 19999 is open on the firewall and Netdata is running. Verify your network security settings allow connections to that port from your machine. - Is it possible to install Netdata on other Linux distributions?
Yes, Netdata supports numerous Linux distributions, including Ubuntu, Arch Linux, and Alpine Linux. Each distro may have slight variations in the installation steps. - Can I monitor applications other than Nginx with Netdata?
Absolutely! Netdata supports various applications, such as MySQL, MongoDB, and Apache, using its extensive range of modules. - What if the ‘stub_status’ module isn’t available in my Nginx version?
You may need to compile Nginx with the ‘stub_status’ module or ensure you’re not using a minimal Nginx package lacking this module.